Estimated Value: $210,090 - $281,000
3
Beds
2
Baths
1,458
Sq Ft
$169/Sq Ft
Est. Value
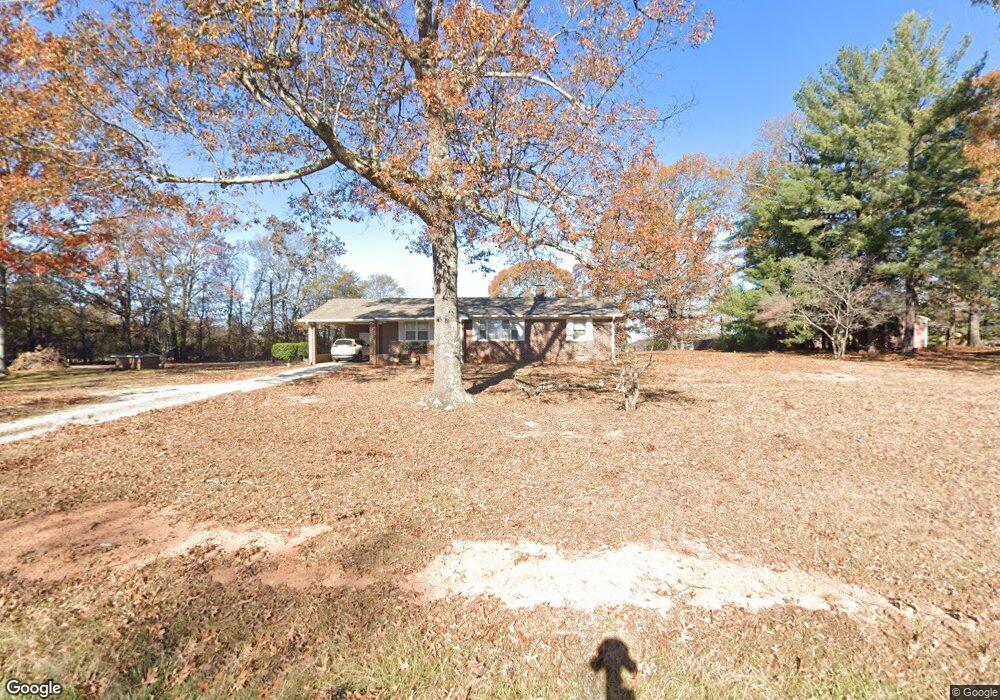
About This Home
This home is located at 397 Hampton Rd, Lyman, SC 29365 and is currently estimated at $246,773, approximately $169 per square foot. 397 Hampton Rd is a home located in Spartanburg County with nearby schools including Lyman Elementary School, D.R. Hill Middle School, and Byrnes Freshman Academy.
Ownership History
Date
Name
Owned For
Owner Type
Purchase Details
Closed on
Jun 18, 2008
Sold by
Edge Barry N
Bought by
Mccain Carol J
Current Estimated Value
Home Financials for this Owner
Home Financials are based on the most recent Mortgage that was taken out on this home.
Original Mortgage
$87,875
Outstanding Balance
$56,129
Interest Rate
5.96%
Mortgage Type
Purchase Money Mortgage
Estimated Equity
$190,644
Purchase Details
Closed on
Jun 16, 2008
Sold by
Edge David O and Edge Frances M
Bought by
Edge Barry N
Home Financials for this Owner
Home Financials are based on the most recent Mortgage that was taken out on this home.
Original Mortgage
$87,875
Outstanding Balance
$56,129
Interest Rate
5.96%
Mortgage Type
Purchase Money Mortgage
Estimated Equity
$190,644
Create a Home Valuation Report for This Property
The Home Valuation Report is an in-depth analysis detailing your home's value as well as a comparison with similar homes in the area
Home Values in the Area
Average Home Value in this Area
Purchase History
| Date | Buyer | Sale Price | Title Company |
|---|---|---|---|
| Mccain Carol J | $92,500 | -- | |
| Edge Barry N | -- | -- |
Source: Public Records
Mortgage History
| Date | Status | Borrower | Loan Amount |
|---|---|---|---|
| Open | Mccain Carol J | $87,875 | |
| Closed | Edge Barry N | $87,875 |
Source: Public Records
Tax History
| Year | Tax Paid | Tax Assessment Tax Assessment Total Assessment is a certain percentage of the fair market value that is determined by local assessors to be the total taxable value of land and additions on the property. | Land | Improvement |
|---|---|---|---|---|
| 2022 | $667 | $4,244 | $600 | $3,644 |
| 2021 | $667 | $4,244 | $600 | $3,644 |
| 2020 | $651 | $4,244 | $600 | $3,644 |
| 2019 | $651 | $4,244 | $600 | $3,644 |
| 2018 | $630 | $4,244 | $600 | $3,644 |
| 2017 | $554 | $3,744 | $600 | $3,144 |
| 2016 | $535 | $3,744 | $600 | $3,144 |
| 2015 | $530 | $3,744 | $600 | $3,144 |
| 2014 | $525 | $3,744 | $600 | $3,144 |
Source: Public Records
Map
Nearby Homes
- 1013 Maraschino Way
- 2043 Renata Lee Dr
- 310 Timothy Paul Dr
- 1820 Rosalyn Dew Dr
- 1179 Staghorn Ave
- 1027 Staghorn Ave
- 1131 Staghorn Ave
- 1785 Rose Hip Dr
- 1777 Rose Hip Dr
- 69 State Road S-42-2901
- 1774 Rose Hip Dr
- 1773 Rose Hip Dr
- 1770 Rose Hip Dr
- 1769 Rose Hip Dr
- 1766 Rose Hip Dr
- 1765 Rose Hip Dr
- 1761 Rose Hip Dr
- 1758 Rose Hip Dr
- 1757 Rose Hip Dr
- 1746 Rose Hip Dr
Your Personal Tour Guide
Ask me questions while you tour the home.