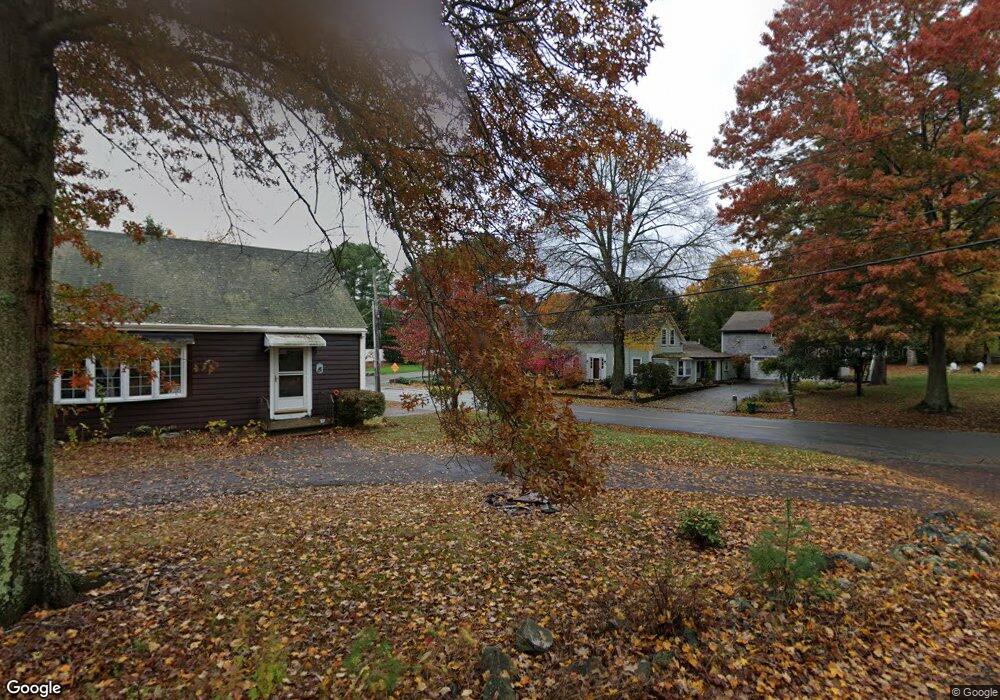
397 Linebrook Rd Ipswich, MA 01938
Estimated Value: $855,730 - $961,000
3
Beds
3
Baths
1,828
Sq Ft
$485/Sq Ft
Est. Value
About This Home
This home is located at 397 Linebrook Rd, Ipswich, MA 01938 and is currently estimated at $885,683, approximately $484 per square foot. 397 Linebrook Rd is a home located in Essex County with nearby schools including Ipswich High School, Clark School, and North Shore Montessori School.
Ownership History
Date
Name
Owned For
Owner Type
Purchase Details
Closed on
Dec 11, 2023
Sold by
Okeefe Kevin M and Okeefe Robin
Bought by
Okeefe Kevin M
Current Estimated Value
Home Financials for this Owner
Home Financials are based on the most recent Mortgage that was taken out on this home.
Original Mortgage
$526,000
Outstanding Balance
$517,594
Interest Rate
7.76%
Mortgage Type
New Conventional
Estimated Equity
$368,089
Purchase Details
Closed on
Apr 29, 2004
Sold by
Gianelli Moira A and Gianelli Stephen M
Bought by
Okeefe Kevin M and Okeefe Robin
Purchase Details
Closed on
Nov 16, 1998
Sold by
Gallagher William F and Gallagher Karen J
Bought by
Gianelli Stephen M and Gianelli Moira A
Create a Home Valuation Report for This Property
The Home Valuation Report is an in-depth analysis detailing your home's value as well as a comparison with similar homes in the area
Home Values in the Area
Average Home Value in this Area
Purchase History
| Date | Buyer | Sale Price | Title Company |
|---|---|---|---|
| Okeefe Kevin M | -- | None Available | |
| Okeefe Kevin M | -- | None Available | |
| Okeefe Kevin M | -- | None Available | |
| Okeefe Kevin M | $505,000 | -- | |
| Gianelli Stephen M | $272,000 | -- | |
| Okeefe Kevin M | $505,000 | -- | |
| Gianelli Stephen M | $272,000 | -- |
Source: Public Records
Mortgage History
| Date | Status | Borrower | Loan Amount |
|---|---|---|---|
| Open | Okeefe Kevin M | $526,000 | |
| Closed | Okeefe Kevin M | $0 | |
| Closed | Okeefe Kevin M | $526,000 | |
| Previous Owner | Gianelli Stephen M | $31,499 | |
| Previous Owner | Gianelli Stephen M | $417,000 |
Source: Public Records
Tax History
| Year | Tax Paid | Tax Assessment Tax Assessment Total Assessment is a certain percentage of the fair market value that is determined by local assessors to be the total taxable value of land and additions on the property. | Land | Improvement |
|---|---|---|---|---|
| 2025 | $8,294 | $743,900 | $265,900 | $478,000 |
| 2024 | $7,812 | $686,500 | $265,500 | $421,000 |
| 2023 | $8,220 | $672,100 | $248,900 | $423,200 |
| 2022 | $7,674 | $596,700 | $215,700 | $381,000 |
| 2021 | $7,512 | $568,200 | $215,700 | $352,500 |
| 2020 | $7,079 | $504,900 | $199,200 | $305,700 |
| 2019 | $7,020 | $498,200 | $199,200 | $299,000 |
| 2018 | $6,898 | $484,400 | $199,200 | $285,200 |
| 2017 | $6,647 | $468,400 | $189,200 | $279,200 |
| 2016 | $6,507 | $438,200 | $179,200 | $259,000 |
| 2015 | $5,831 | $431,600 | $172,600 | $259,000 |
Source: Public Records
Map
Nearby Homes
- 5 Cobblers Ln
- 16 Fairway Dr Unit 16
- 37 East St
- 12 Campmeeting Rd
- 75 Country Club Way
- 54 Willowdale Rd
- 870 Haverhill St Unit 2B
- 870 Haverhill St Unit 21B
- 76-78 Daniels Rd
- 10 Choate Ln
- 196 Country Club Way
- 4 Ruby Cir
- 17 1/2 Averill St
- 38 Buttonwood
- 38 Buttonwood Unit 30
- 30 Buttonwood
- 107 King George Dr Unit 9
- 36 Main St Unit 1
- 53 Woodcrest Rd
- 480 Newburyport Turnpike
Your Personal Tour Guide
Ask me questions while you tour the home.