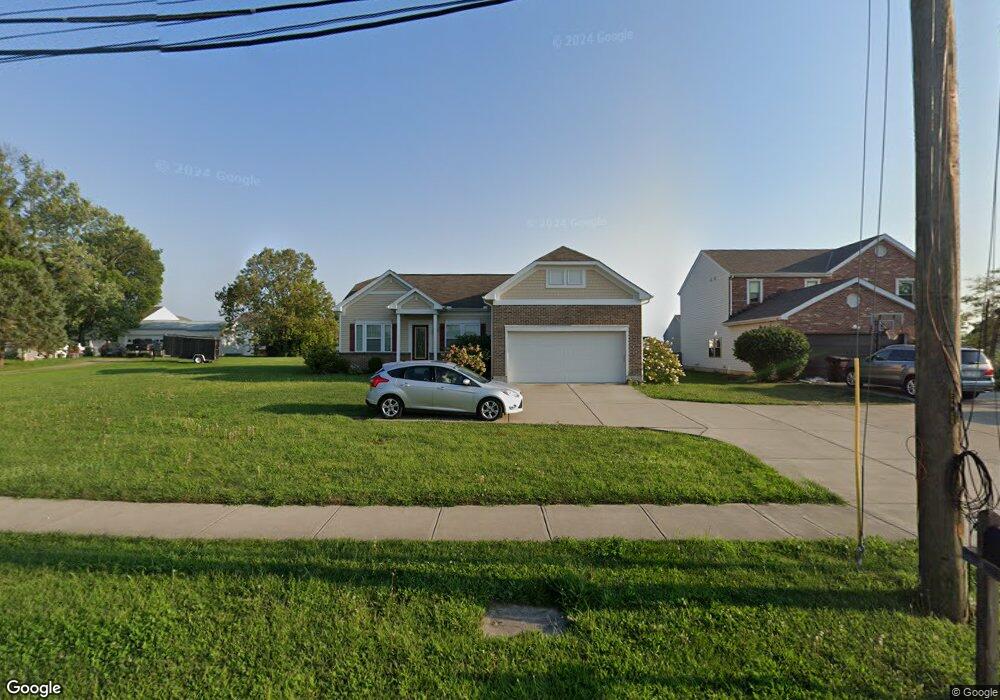
397 MacReady Ave Monroe, OH 45050
Estimated Value: $314,000 - $399,962
3
Beds
3
Baths
1,656
Sq Ft
$224/Sq Ft
Est. Value
About This Home
This home is located at 397 MacReady Ave, Monroe, OH 45050 and is currently estimated at $370,991, approximately $224 per square foot. 397 MacReady Ave is a home with nearby schools including Monroe Primary School, Monroe Elementary School, and Monroe Junior High School.
Ownership History
Date
Name
Owned For
Owner Type
Purchase Details
Closed on
Sep 4, 2024
Sold by
Henson Brittany and Bush Brittany M
Bought by
Rosen Heather M and Floyd Jon C
Current Estimated Value
Home Financials for this Owner
Home Financials are based on the most recent Mortgage that was taken out on this home.
Original Mortgage
$290,400
Outstanding Balance
$286,520
Interest Rate
6.78%
Mortgage Type
New Conventional
Estimated Equity
$84,471
Purchase Details
Closed on
Mar 21, 2017
Sold by
Henson Gregory G
Bought by
Gould Brittany M and Henson Brittany
Home Financials for this Owner
Home Financials are based on the most recent Mortgage that was taken out on this home.
Original Mortgage
$189,255
Interest Rate
4.15%
Mortgage Type
FHA
Purchase Details
Closed on
Oct 24, 2014
Sold by
Mronda Homes Of Ohio Inc
Bought by
Henson Gregory G and Henson Brittany
Home Financials for this Owner
Home Financials are based on the most recent Mortgage that was taken out on this home.
Original Mortgage
$192,768
Interest Rate
4.21%
Mortgage Type
New Conventional
Create a Home Valuation Report for This Property
The Home Valuation Report is an in-depth analysis detailing your home's value as well as a comparison with similar homes in the area
Home Values in the Area
Average Home Value in this Area
Purchase History
| Date | Buyer | Sale Price | Title Company |
|---|---|---|---|
| Rosen Heather M | $363,000 | None Listed On Document | |
| Gould Brittany M | -- | None Available | |
| Henson Gregory G | $189,363 | None Available |
Source: Public Records
Mortgage History
| Date | Status | Borrower | Loan Amount |
|---|---|---|---|
| Open | Rosen Heather M | $290,400 | |
| Previous Owner | Gould Brittany M | $189,255 | |
| Previous Owner | Henson Gregory G | $192,768 |
Source: Public Records
Tax History
| Year | Tax Paid | Tax Assessment Tax Assessment Total Assessment is a certain percentage of the fair market value that is determined by local assessors to be the total taxable value of land and additions on the property. | Land | Improvement |
|---|---|---|---|---|
| 2025 | $5,397 | $1,200 | $1,200 | -- |
| 2024 | $5,397 | $119,810 | $23,400 | $96,410 |
| 2023 | $5,361 | $125,960 | $23,400 | $102,560 |
| 2022 | $4,182 | $82,340 | $23,400 | $58,940 |
| 2021 | $4,029 | $82,340 | $23,400 | $58,940 |
| 2020 | $4,173 | $82,340 | $23,400 | $58,940 |
| 2019 | $3,940 | $72,100 | $22,530 | $49,570 |
| 2018 | $3,945 | $72,100 | $22,530 | $49,570 |
| 2017 | $4,028 | $72,100 | $22,530 | $49,570 |
| 2016 | $3,825 | $65,640 | $22,530 | $43,110 |
| 2015 | $3,782 | $65,640 | $22,530 | $43,110 |
| 2014 | $428 | $7,000 | $7,000 | $0 |
| 2013 | $428 | $7,000 | $7,000 | $0 |
Source: Public Records
Map
Nearby Homes
- 852 Willowbrook Dr
- 345 Sunset Ct
- 202 Sands Ave
- 1753 Weatherstone Cir Unit 13G6
- 856 Hocking Meadow Cir
- 921 Heritage Green Dr Unit 9302
- 32 W Elm St
- 47 Ethel Dr
- 360 Britton Ln
- 100 N Main St
- 195 Brittony Woods Dr
- 15 Old Orchard Ln
- 132 Village Ct
- 6893 Gaspar Trail
- 155 Keswick Dr
- 513 Austin Smith Dr
- 320 Bridle Pass Way
- 326 Sackett Dr
- 916 S Main St
- 965 Rustic Ct
- 419 MacReady Ave
- 824 Willowbrook Dr
- 826 Willowbrook Dr
- 820 Willowbrook Dr
- 828 Willowbrook Dr
- 381 MacReady Ave
- 830 Willowbrook Dr
- 823 Willowbrook Dr
- 502 Wyandot Woods Blvd
- 827 Willowbrook Dr
- 363 MacReady Ave
- 910 Sleepy Hollow Dr
- 832 Willowbrook Dr
- 431 MacReady Ave
- 829 Willowbrook Dr
- 380 MacReady Ave
- 380 MacReady Ave
- 508 Wyandot Woods Blvd
- 912 Sleepy Hollow Dr
- 501 Wyandot Woods Blvd
Your Personal Tour Guide
Ask me questions while you tour the home.