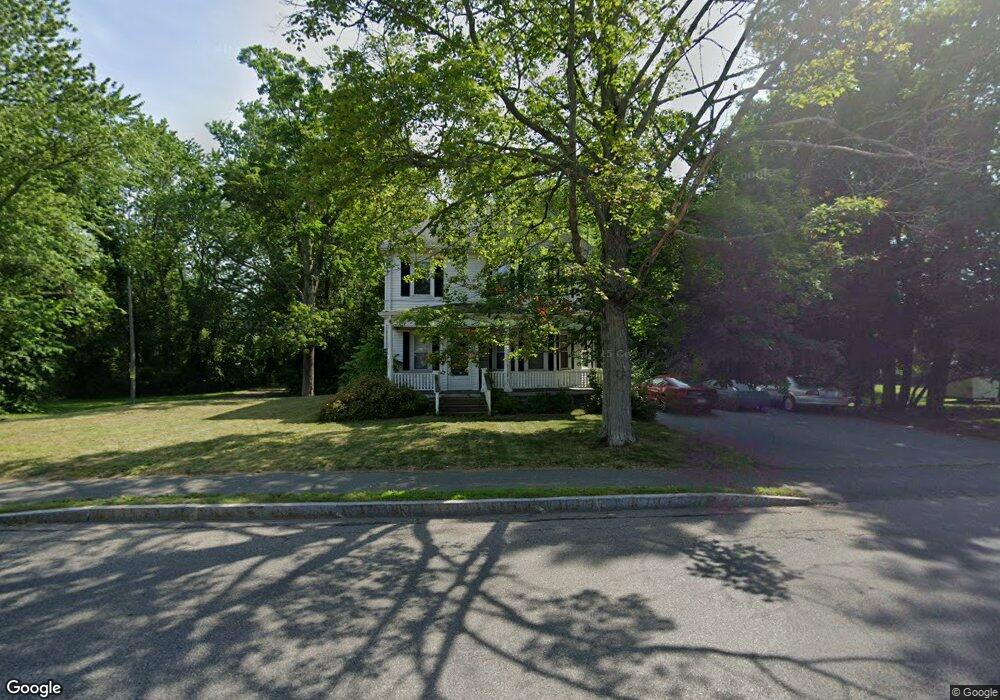
397 Main St Bridgewater, MA 02324
Estimated Value: $570,000 - $602,899
4
Beds
2
Baths
1,888
Sq Ft
$311/Sq Ft
Est. Value
About This Home
This home is located at 397 Main St, Bridgewater, MA 02324 and is currently estimated at $586,975, approximately $310 per square foot. 397 Main St is a home located in Plymouth County with nearby schools including Mitchell Elementary School, Williams Intermediate School, and Bridgewater Middle School.
Ownership History
Date
Name
Owned For
Owner Type
Purchase Details
Closed on
Aug 31, 2007
Sold by
Lombard Marjorie A
Bought by
Lithgow Glenn H and Lithgow Jennifer E
Current Estimated Value
Home Financials for this Owner
Home Financials are based on the most recent Mortgage that was taken out on this home.
Original Mortgage
$297,350
Outstanding Balance
$189,608
Interest Rate
6.71%
Mortgage Type
Purchase Money Mortgage
Estimated Equity
$397,367
Purchase Details
Closed on
Jan 14, 2000
Sold by
Goguen Mary C and Goguen Timothy P
Bought by
Lombard Marjorie A
Home Financials for this Owner
Home Financials are based on the most recent Mortgage that was taken out on this home.
Original Mortgage
$166,250
Interest Rate
7.79%
Mortgage Type
Purchase Money Mortgage
Create a Home Valuation Report for This Property
The Home Valuation Report is an in-depth analysis detailing your home's value as well as a comparison with similar homes in the area
Home Values in the Area
Average Home Value in this Area
Purchase History
| Date | Buyer | Sale Price | Title Company |
|---|---|---|---|
| Lithgow Glenn H | $313,000 | -- | |
| Lombard Marjorie A | $175,000 | -- |
Source: Public Records
Mortgage History
| Date | Status | Borrower | Loan Amount |
|---|---|---|---|
| Open | Lombard Marjorie A | $297,350 | |
| Previous Owner | Lombard Marjorie A | $201,500 | |
| Previous Owner | Lombard Marjorie A | $165,000 | |
| Previous Owner | Lombard Marjorie A | $166,250 |
Source: Public Records
Tax History Compared to Growth
Tax History
| Year | Tax Paid | Tax Assessment Tax Assessment Total Assessment is a certain percentage of the fair market value that is determined by local assessors to be the total taxable value of land and additions on the property. | Land | Improvement |
|---|---|---|---|---|
| 2025 | $5,562 | $470,200 | $164,600 | $305,600 |
| 2024 | $5,300 | $436,600 | $148,000 | $288,600 |
| 2023 | $5,241 | $408,200 | $138,300 | $269,900 |
| 2022 | $5,135 | $358,600 | $121,400 | $237,200 |
| 2021 | $4,783 | $330,300 | $108,400 | $221,900 |
| 2020 | $4,585 | $311,300 | $104,200 | $207,100 |
| 2019 | $4,473 | $301,600 | $104,200 | $197,400 |
| 2018 | $4,191 | $275,900 | $113,100 | $162,800 |
| 2017 | $4,113 | $263,500 | $113,100 | $150,400 |
| 2016 | $3,981 | $256,200 | $110,900 | $145,300 |
| 2015 | $3,920 | $241,400 | $102,000 | $139,400 |
| 2014 | $3,845 | $236,600 | $99,000 | $137,600 |
Source: Public Records
Map
Nearby Homes
- 4 Mullen Way
- 60 Miranda Way
- 10 Duck Farm Ln
- 116 Center St
- 18 Aldrich Rd
- 248 Center St Unit 7
- 180 Main St Unit A15
- 180 Main St Unit A5
- 12 Perkins St
- 128 Broad St
- Lot 3 Fontana Way
- 74 Mount Prospect St
- 30 Keenan St
- 167 Spring St
- 580 Broad St Unit 1
- 580 Broad St Unit 2
- 603 East St
- Lot 2 Fontana Way
- 10 College Rd
- 130 Maple Ave