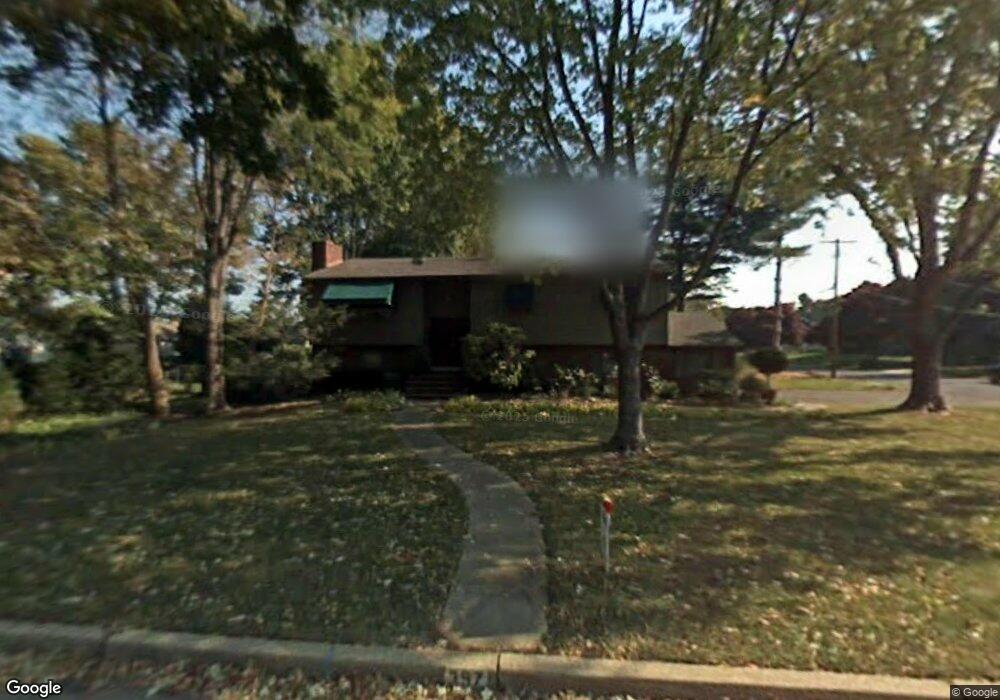
397 Port Au Peck Ave Oceanport, NJ 07757
Estimated Value: $928,000 - $1,068,000
4
Beds
3
Baths
2,464
Sq Ft
$412/Sq Ft
Est. Value
About This Home
This home is located at 397 Port Au Peck Ave, Oceanport, NJ 07757 and is currently estimated at $1,015,909, approximately $412 per square foot. 397 Port Au Peck Ave is a home located in Monmouth County with nearby schools including Wolf Hill Elementary School, Maple Place Elementary and Middle School, and Shore Regional High School.
Ownership History
Date
Name
Owned For
Owner Type
Purchase Details
Closed on
May 28, 2010
Sold by
Kestly Elizabeth
Bought by
Parker Charles F and Parker Stacey
Current Estimated Value
Home Financials for this Owner
Home Financials are based on the most recent Mortgage that was taken out on this home.
Original Mortgage
$257,000
Outstanding Balance
$146,177
Interest Rate
5%
Mortgage Type
Purchase Money Mortgage
Estimated Equity
$869,732
Create a Home Valuation Report for This Property
The Home Valuation Report is an in-depth analysis detailing your home's value as well as a comparison with similar homes in the area
Home Values in the Area
Average Home Value in this Area
Purchase History
| Date | Buyer | Sale Price | Title Company |
|---|---|---|---|
| Parker Charles F | $365,000 | None Available |
Source: Public Records
Mortgage History
| Date | Status | Borrower | Loan Amount |
|---|---|---|---|
| Open | Parker Charles F | $257,000 |
Source: Public Records
Tax History Compared to Growth
Tax History
| Year | Tax Paid | Tax Assessment Tax Assessment Total Assessment is a certain percentage of the fair market value that is determined by local assessors to be the total taxable value of land and additions on the property. | Land | Improvement |
|---|---|---|---|---|
| 2025 | $12,131 | $821,000 | $396,000 | $425,000 |
| 2024 | $12,372 | $768,300 | $361,800 | $406,500 |
| 2023 | $12,372 | $743,500 | $357,300 | $386,200 |
| 2022 | $9,364 | $564,800 | $312,300 | $252,500 |
| 2021 | $9,364 | $525,400 | $285,300 | $240,100 |
| 2020 | $9,447 | $516,800 | $270,000 | $246,800 |
| 2019 | $8,989 | $499,100 | $261,000 | $238,100 |
| 2018 | $8,879 | $496,300 | $261,000 | $235,300 |
| 2017 | $8,395 | $389,200 | $155,700 | $233,500 |
| 2016 | $8,381 | $391,100 | $162,000 | $229,100 |
| 2015 | $7,989 | $366,400 | $162,000 | $204,400 |
| 2014 | $7,207 | $352,400 | $171,000 | $181,400 |
Source: Public Records
Map
Nearby Homes
- 15 Signal Ave
- 66 Shrewsbury Ave
- 8 Pocahontas Ave
- 13 Morris Place
- 3 Foggia Way
- 580 Patten Ave Unit 48
- 580 Patten Ave Unit 62
- 580 Patten Ave Unit 86
- 580 Patten Ave Unit 31
- 28 Patten Ln
- 10 Asbury Ave
- 5 Marine Place
- 165 Kingsley St
- 16 Shore Dr
- 265 Port Au Peck Ave
- 222 Coleman Ave
- 392 Florence Ave
- 164 Airsdale Ave
- 15 Airsdale Ave
- 190 Spruce St Unit 4
- 49 Sagamore Ave
- 401 Port Au Peck Ave
- 45 Sagamore Ave
- 84 Monmouth Blvd
- 50 Sagamore Ave
- 396 Port Au Peck Ave
- 400 Port Au Peck Ave
- 46 Sagamore Ave
- 43 Sagamore Ave
- 80 Monmouth Blvd
- 387 Port Au Peck Ave
- 0 Monmouth Blvd
- 23 Iroquois Ave
- 63 Sagamore Ave
- 19 Iroquois Ave
- 100 Monmouth Blvd
- 40 Sagamore Ave
- 78 Monmouth Blvd
- 384 Port Au Peck Ave
- 62 Sagamore Ave