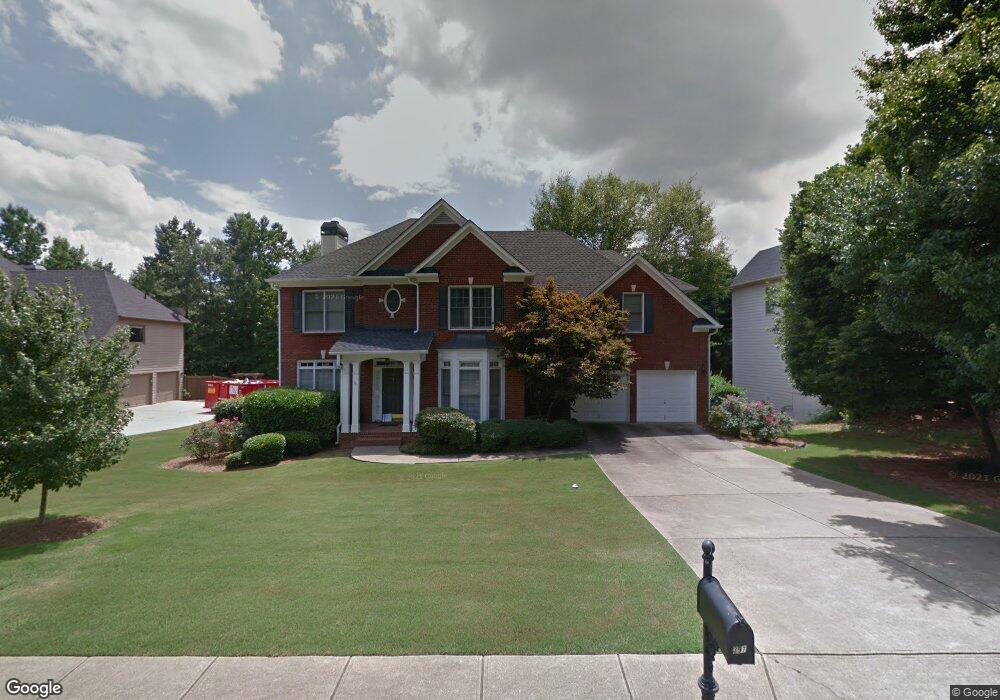
397 Rhodes House Dr Unit 1 Suwanee, GA 30024
Estimated Value: $590,973 - $673,000
4
Beds
4
Baths
2,834
Sq Ft
$222/Sq Ft
Est. Value
About This Home
This home is located at 397 Rhodes House Dr Unit 1, Suwanee, GA 30024 and is currently estimated at $628,743, approximately $221 per square foot. 397 Rhodes House Dr Unit 1 is a home located in Gwinnett County with nearby schools including Roberts Elementary School, North Gwinnett Middle School, and North Gwinnett High School.
Ownership History
Date
Name
Owned For
Owner Type
Purchase Details
Closed on
Jul 8, 2005
Sold by
Bhatt Hemanshu P
Bought by
Bhatt Hemanshu P and Bhatt Kripa
Current Estimated Value
Home Financials for this Owner
Home Financials are based on the most recent Mortgage that was taken out on this home.
Original Mortgage
$205,000
Outstanding Balance
$104,821
Interest Rate
5.54%
Mortgage Type
New Conventional
Estimated Equity
$523,922
Purchase Details
Closed on
Dec 20, 2001
Sold by
Sharp Residential Builders & Devel
Bought by
Swett George I and Swett Olikve F
Home Financials for this Owner
Home Financials are based on the most recent Mortgage that was taken out on this home.
Original Mortgage
$140,000
Interest Rate
6.85%
Mortgage Type
New Conventional
Create a Home Valuation Report for This Property
The Home Valuation Report is an in-depth analysis detailing your home's value as well as a comparison with similar homes in the area
Home Values in the Area
Average Home Value in this Area
Purchase History
| Date | Buyer | Sale Price | Title Company |
|---|---|---|---|
| Bhatt Hemanshu P | $295,000 | -- | |
| Bhatt Hemanshu P | $295,000 | -- | |
| Swett George I | $261,800 | -- |
Source: Public Records
Mortgage History
| Date | Status | Borrower | Loan Amount |
|---|---|---|---|
| Open | Bhatt Hemanshu P | $205,000 | |
| Previous Owner | Swett George I | $140,000 |
Source: Public Records
Tax History Compared to Growth
Tax History
| Year | Tax Paid | Tax Assessment Tax Assessment Total Assessment is a certain percentage of the fair market value that is determined by local assessors to be the total taxable value of land and additions on the property. | Land | Improvement |
|---|---|---|---|---|
| 2025 | $6,047 | $276,200 | $44,080 | $232,120 |
| 2024 | $6,204 | $217,000 | $42,000 | $175,000 |
| 2023 | $6,204 | $217,000 | $42,000 | $175,000 |
| 2022 | $4,881 | $205,520 | $42,000 | $163,520 |
| 2021 | $4,963 | $154,400 | $35,600 | $118,800 |
| 2020 | $4,880 | $148,880 | $30,000 | $118,880 |
| 2019 | $4,740 | $148,880 | $30,000 | $118,880 |
| 2018 | $4,465 | $135,720 | $30,000 | $105,720 |
| 2016 | $3,897 | $108,680 | $24,800 | $83,880 |
| 2015 | $3,937 | $108,680 | $24,800 | $83,880 |
| 2014 | $3,617 | $97,640 | $20,400 | $77,240 |
Source: Public Records
Map
Nearby Homes
- 358 Rhodes House Ct
- 4394 Austin Hills Dr Unit 1
- 4614 Austin Hills Dr
- 4244 Austin Hills Dr
- 3720 Brookefall Landing
- 4045 Hillcrest View Ct
- 3713 Lake Edge Dr
- 407 Vista Lake Dr
- 4186 Terrace Oaks Ct
- 366 Regal Pines Ct
- 3998 Oak Crossing Dr NE
- 4450 Woodward Walk Ln
- 3612 Brookefall Ct
- 3941 Oak Crossing Dr
- 4273 Winslow Hill Ct
- 3720 Crescent Walk Ln
- 3740 Crescent Walk Ln
- 384 Creek Manor Way
- 297 Dogwood View Ln
- 377 Rhodes House Dr
- 0 Rhodes House Dr Unit 3210017
- 0 Rhodes House Dr
- 407 Rhodes House Dr
- 328 Rhodes House Ct
- 338 Rhodes House Ct
- 438 Rhodes House Dr
- 338 Rhodes House Ct
- 4027 Wyndam Hill Dr
- 4017 Wyndam Hill Dr
- 388 Rhodes House Dr
- 348 Rhodes House Ct
- 417 Rhodes House Dr
- 378 Rhodes House Dr Unit 89
- 427 Rhodes House Dr
- 368 Rhodes House Dr
- 448 Rhodes House Dr Unit 1
- 437 Rhodes House Dr
- 447 Rhodes House Dr Unit 1
- 4057 Wyndam Hill Dr