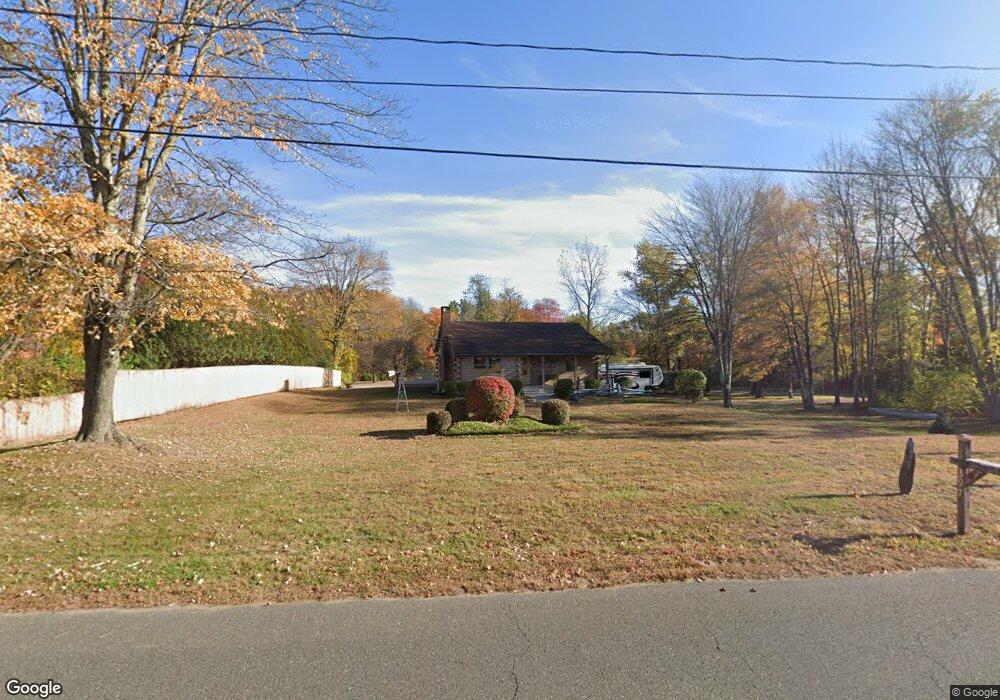
397 Root Rd Westfield, MA 01085
Estimated Value: $336,452 - $485,000
2
Beds
1
Bath
1,092
Sq Ft
$369/Sq Ft
Est. Value
About This Home
This home is located at 397 Root Rd, Westfield, MA 01085 and is currently estimated at $403,363, approximately $369 per square foot. 397 Root Rd is a home located in Hampden County with nearby schools including Westfield High School, White Oak School, and Westfield Christian Academy.
Ownership History
Date
Name
Owned For
Owner Type
Purchase Details
Closed on
Jul 16, 1993
Sold by
Scott David B and Scott Donna A
Bought by
Giguere Joseph F and Lajeunesse Nancy A
Current Estimated Value
Home Financials for this Owner
Home Financials are based on the most recent Mortgage that was taken out on this home.
Original Mortgage
$118,800
Interest Rate
7.4%
Mortgage Type
Purchase Money Mortgage
Create a Home Valuation Report for This Property
The Home Valuation Report is an in-depth analysis detailing your home's value as well as a comparison with similar homes in the area
Home Values in the Area
Average Home Value in this Area
Purchase History
| Date | Buyer | Sale Price | Title Company |
|---|---|---|---|
| Giguere Joseph F | $132,000 | -- |
Source: Public Records
Mortgage History
| Date | Status | Borrower | Loan Amount |
|---|---|---|---|
| Closed | Giguere Joseph F | $118,800 | |
| Previous Owner | Giguere Joseph F | $14,597 | |
| Previous Owner | Giguere Joseph F | $15,000 |
Source: Public Records
Tax History
| Year | Tax Paid | Tax Assessment Tax Assessment Total Assessment is a certain percentage of the fair market value that is determined by local assessors to be the total taxable value of land and additions on the property. | Land | Improvement |
|---|---|---|---|---|
| 2025 | $4,880 | $321,500 | $139,300 | $182,200 |
| 2024 | $4,940 | $309,300 | $127,100 | $182,200 |
| 2023 | $4,693 | $287,000 | $121,000 | $166,000 |
| 2022 | $4,693 | $253,800 | $107,500 | $146,300 |
| 2021 | $4,541 | $240,500 | $101,400 | $139,100 |
| 2020 | $4,620 | $240,000 | $101,400 | $138,600 |
| 2019 | $4,512 | $229,400 | $96,600 | $132,800 |
| 2018 | $4,426 | $228,600 | $96,600 | $132,000 |
| 2017 | $4,352 | $224,100 | $97,900 | $126,200 |
| 2016 | $4,357 | $224,100 | $97,900 | $126,200 |
| 2015 | $4,214 | $227,300 | $97,900 | $129,400 |
| 2014 | $3,152 | $227,300 | $97,900 | $129,400 |
Source: Public Records
Map
Nearby Homes
- 336 Russellville Rd
- 132 North Rd
- 7 1st Ave
- 6 Madison Ave
- 16 1st Ave
- Lot 5 Brickyard Rd
- 119 Brickyard Rd
- 202 Brickyard Rd
- 868 Southampton Rd Unit 54
- 868 Southampton Rd Unit 70
- 45 Jaeger Dr
- 458 Montgomery Rd
- 21 Old County Rd
- 150 Middle Rd
- 0 Char Dr
- 57 White Loaf Rd
- 19 Cottage Ave
- 5 Day Lily Ln
- 21 Rider Rd
- 76 High St
Your Personal Tour Guide
Ask me questions while you tour the home.