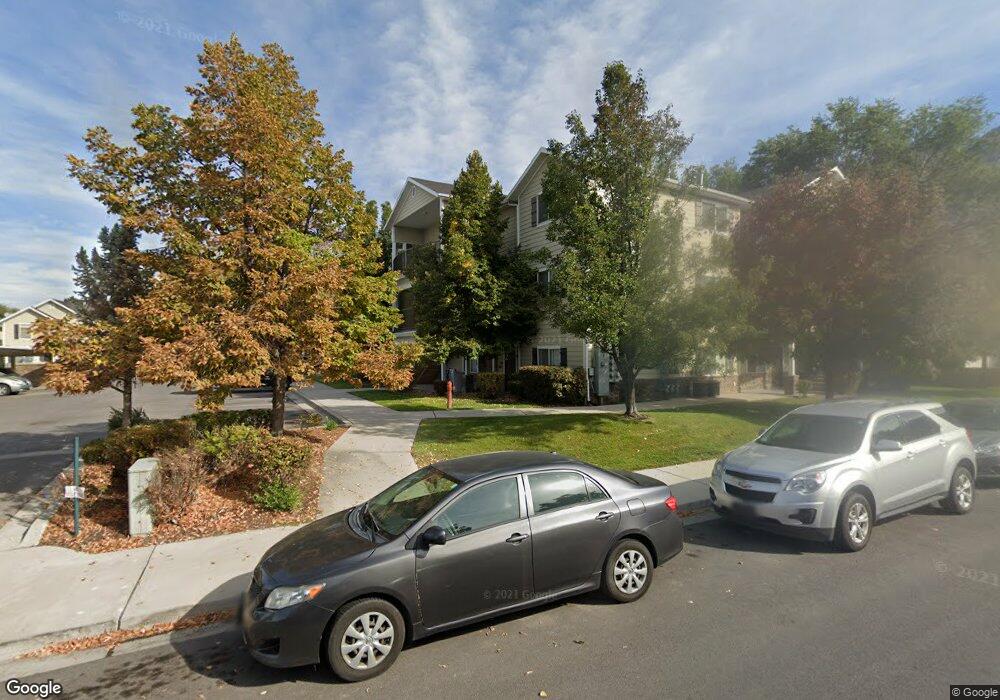
397 S State St Provo, UT 84606
Provost NeighborhoodEstimated Value: $304,000 - $340,118
3
Beds
2
Baths
1,143
Sq Ft
$283/Sq Ft
Est. Value
About This Home
This home is located at 397 S State St, Provo, UT 84606 and is currently estimated at $323,373, approximately $282 per square foot. 397 S State St is a home located in Utah County with nearby schools including Provost School, Centennial Middle School, and Timpview High School.
Ownership History
Date
Name
Owned For
Owner Type
Purchase Details
Closed on
Oct 15, 2008
Sold by
Peay Craig
Bought by
Peay Craig R
Current Estimated Value
Purchase Details
Closed on
Sep 12, 2007
Sold by
Peay Craig R
Bought by
Peay Craig R and Peay Andree L
Home Financials for this Owner
Home Financials are based on the most recent Mortgage that was taken out on this home.
Original Mortgage
$100,500
Outstanding Balance
$63,955
Interest Rate
6.67%
Mortgage Type
Purchase Money Mortgage
Estimated Equity
$259,418
Purchase Details
Closed on
Aug 28, 2007
Sold by
Canyon Village Investments Llc
Bought by
Peay Craig R
Home Financials for this Owner
Home Financials are based on the most recent Mortgage that was taken out on this home.
Original Mortgage
$100,500
Outstanding Balance
$63,955
Interest Rate
6.67%
Mortgage Type
Purchase Money Mortgage
Estimated Equity
$259,418
Create a Home Valuation Report for This Property
The Home Valuation Report is an in-depth analysis detailing your home's value as well as a comparison with similar homes in the area
Home Values in the Area
Average Home Value in this Area
Purchase History
| Date | Buyer | Sale Price | Title Company |
|---|---|---|---|
| Peay Craig R | -- | Security Title & Abstract | |
| Peay Craig R | -- | Security Title & Abstract | |
| Peay Craig R | -- | Security Title & Abstract |
Source: Public Records
Mortgage History
| Date | Status | Borrower | Loan Amount |
|---|---|---|---|
| Open | Peay Craig R | $100,500 |
Source: Public Records
Tax History
| Year | Tax Paid | Tax Assessment Tax Assessment Total Assessment is a certain percentage of the fair market value that is determined by local assessors to be the total taxable value of land and additions on the property. | Land | Improvement |
|---|---|---|---|---|
| 2025 | $1,686 | $174,680 | -- | -- |
| 2024 | $1,686 | $165,935 | $0 | $0 |
| 2023 | $1,665 | $161,535 | $0 | $0 |
| 2022 | $1,520 | $148,720 | $0 | $0 |
| 2021 | $1,278 | $218,100 | $26,200 | $191,900 |
| 2020 | $1,260 | $201,600 | $24,200 | $177,400 |
| 2019 | $1,096 | $182,400 | $23,800 | $158,600 |
| 2018 | $936 | $158,000 | $21,900 | $136,100 |
| 2017 | $860 | $79,750 | $0 | $0 |
| 2016 | $923 | $79,750 | $0 | $0 |
| 2015 | $894 | $78,100 | $0 | $0 |
| 2014 | $785 | $71,500 | $0 | $0 |
Source: Public Records
Map
Nearby Homes
- 397 S State St Unit 37
- 397 S State St
- 397 S State St
- 397 S State St
- 397 S State St
- 397 S State St Unit 31
- 397 S State St
- 397 S State St
- 397 S State St
- 397 S State St
- 397 S State St Unit 26
- 397 S State St
- 397 S State St Unit 35
- 397 S State St Unit 36
- 397 S State St Unit 29
- 397 S State St Unit 27
- 397 S State St Unit 38
- 397 S State St Unit 33
- 397 S State St Unit 28
- 397 S State St Unit 34
Your Personal Tour Guide
Ask me questions while you tour the home.