3970 W 150th Ct Crown Point, IN 46307
Estimated Value: $857,000 - $908,000
4
Beds
4
Baths
6,158
Sq Ft
$143/Sq Ft
Est. Value
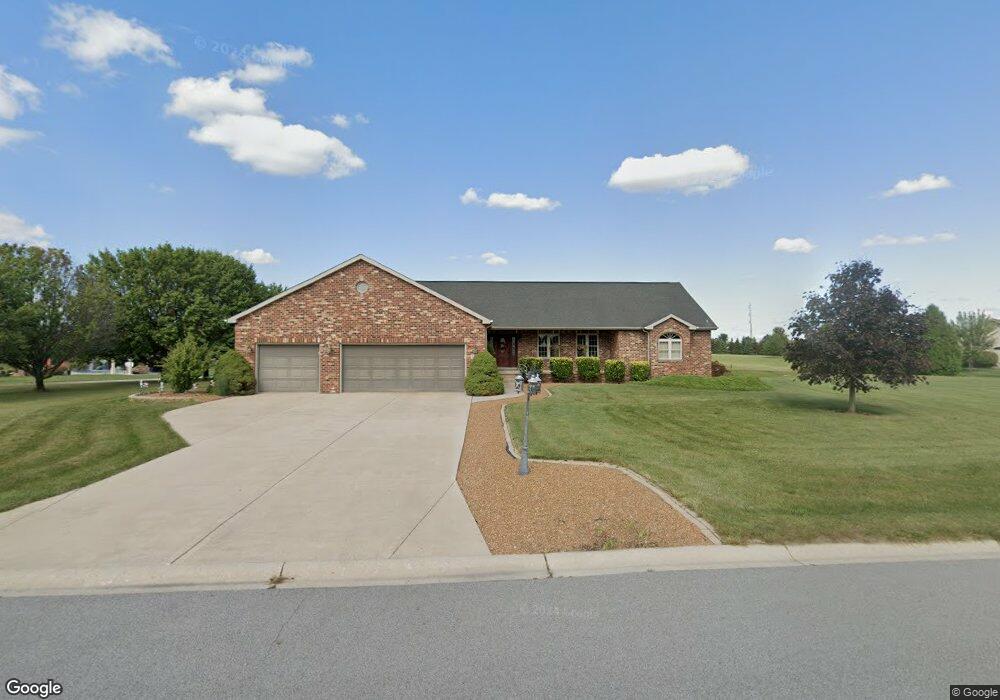
About This Home
This home is located at 3970 W 150th Ct, Crown Point, IN 46307 and is currently estimated at $881,232, approximately $143 per square foot. 3970 W 150th Ct is a home located in Lake County with nearby schools including Lowell Middle School and Lowell Senior High School.
Ownership History
Date
Name
Owned For
Owner Type
Purchase Details
Closed on
Mar 12, 2021
Sold by
Franks Zachary
Bought by
Rath Christian and Rath Cristina Pellegrini
Current Estimated Value
Home Financials for this Owner
Home Financials are based on the most recent Mortgage that was taken out on this home.
Original Mortgage
$536,400
Outstanding Balance
$480,845
Interest Rate
2.7%
Mortgage Type
New Conventional
Estimated Equity
$400,387
Purchase Details
Closed on
Mar 19, 2020
Sold by
Franks Zachary and Zachary Franks Revocable Trust
Bought by
Franks Zachary
Home Financials for this Owner
Home Financials are based on the most recent Mortgage that was taken out on this home.
Original Mortgage
$375,000
Interest Rate
3.4%
Mortgage Type
New Conventional
Purchase Details
Closed on
Nov 15, 2011
Sold by
Rodenbucher Joseph D and Rodenbucher Kathryn L
Bought by
Franks Zachary and Zachary Franks Revocable Trust
Create a Home Valuation Report for This Property
The Home Valuation Report is an in-depth analysis detailing your home's value as well as a comparison with similar homes in the area
Home Values in the Area
Average Home Value in this Area
Purchase History
| Date | Buyer | Sale Price | Title Company |
|---|---|---|---|
| Rath Christian | -- | Greater Indiana Title Company | |
| Franks Zachary | -- | Meridian Title Corp | |
| Franks Zachary | -- | Fidelity Cp |
Source: Public Records
Mortgage History
| Date | Status | Borrower | Loan Amount |
|---|---|---|---|
| Open | Rath Christian | $536,400 | |
| Previous Owner | Franks Zachary | $375,000 |
Source: Public Records
Tax History Compared to Growth
Tax History
| Year | Tax Paid | Tax Assessment Tax Assessment Total Assessment is a certain percentage of the fair market value that is determined by local assessors to be the total taxable value of land and additions on the property. | Land | Improvement |
|---|---|---|---|---|
| 2024 | $13,415 | $735,400 | $107,000 | $628,400 |
| 2023 | $6,376 | $693,900 | $96,500 | $597,400 |
| 2022 | $5,844 | $707,800 | $65,800 | $642,000 |
| 2021 | $5,844 | $621,500 | $65,800 | $555,700 |
| 2020 | $5,784 | $604,300 | $65,800 | $538,500 |
| 2019 | $5,622 | $559,000 | $65,800 | $493,200 |
| 2018 | $5,496 | $547,200 | $65,800 | $481,400 |
| 2017 | $5,663 | $533,700 | $65,800 | $467,900 |
| 2016 | $5,634 | $560,900 | $65,800 | $495,100 |
| 2014 | $5,243 | $510,200 | $65,800 | $444,400 |
| 2013 | $4,957 | $470,700 | $65,800 | $404,900 |
Source: Public Records
Map
Nearby Homes
- 4753 W 153rd Ave
- 2550 W 153rd Ave
- 15773 Hendricks St
- 5200 W 154th Ave
- 5527 W 153rd Ave
- 5125 W 153rd Ave
- 5110 W 154th Ave
- 15806 Clark St
- 1020 N Lakeview Dr
- 16280 Hendricks St
- 789 S Lakeview Dr
- 629 S Lakeview Dr
- 245 Island Dr
- 3315 W 138th Ln
- 14723 King St
- 115 W Lakeview Dr
- 5003 Beacon Ridge
- 14615 Reeder Rd
- 4351 Willard Ln
- 15944 Stevenson St
- 3971 W 150th Ct
- 3840 W 150th Ct
- 3844 W 150th Ct
- 3805 W 150th Ct
- 3910 150th Ct
- 3940 W 150th Ct
- 3908 W 153rd Ave
- 3908 W 153rd Ave
- 3750 W 150th Ct
- 15008 W 150th Ln
- 15028 W 150th Ln
- 14976 W 150th Ln
- 14954 W 150th Ln
- 3845 W 150th Place
- 3751 W 150th Place
- 3845 W 150th Place
- 15058 W 150th Ln
- 3970 150th Place
- 14977 W 150th Ln
- 14997 W 150th Ln