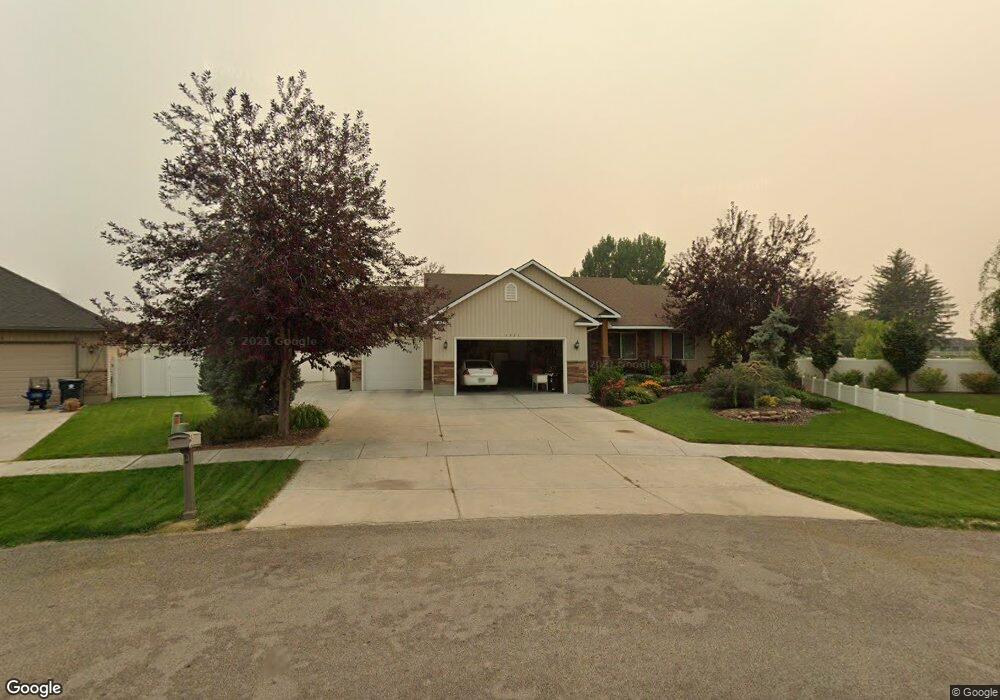
3971 Joshua Ln Idaho Falls, ID 83401
Estimated Value: $437,000 - $498,183
3
Beds
2
Baths
2,998
Sq Ft
$157/Sq Ft
Est. Value
About This Home
This home is located at 3971 Joshua Ln, Idaho Falls, ID 83401 and is currently estimated at $469,296, approximately $156 per square foot. 3971 Joshua Ln is a home located in Bonneville County with nearby schools including Rocky Mountain Middle School, Discovery Elementary School, and Bonneville High School.
Ownership History
Date
Name
Owned For
Owner Type
Purchase Details
Closed on
Jul 17, 2025
Sold by
Andersen Lyle Rex and Andersen Heather
Bought by
Rex And Heather Andersen Family Trust and Andersen
Current Estimated Value
Home Financials for this Owner
Home Financials are based on the most recent Mortgage that was taken out on this home.
Original Mortgage
$50,000
Outstanding Balance
$49,655
Interest Rate
5.99%
Mortgage Type
New Conventional
Estimated Equity
$419,641
Purchase Details
Closed on
Nov 22, 2024
Sold by
Andersen Lyle Rex and Andersen Heather
Bought by
Rex And Heather Andersen Family Trust
Purchase Details
Closed on
Sep 3, 2008
Sold by
Red Rock Estates Llc
Bought by
Andersen Lyle Rex and Andersen Heather
Home Financials for this Owner
Home Financials are based on the most recent Mortgage that was taken out on this home.
Original Mortgage
$110,000
Interest Rate
6.59%
Mortgage Type
New Conventional
Create a Home Valuation Report for This Property
The Home Valuation Report is an in-depth analysis detailing your home's value as well as a comparison with similar homes in the area
Home Values in the Area
Average Home Value in this Area
Purchase History
| Date | Buyer | Sale Price | Title Company |
|---|---|---|---|
| Rex And Heather Andersen Family Trust | -- | Amerititle | |
| Andersen Lyle Rex | -- | Amerititle | |
| Rex And Heather Andersen Family Trust | -- | None Listed On Document | |
| Rex And Heather Andersen Family Trust | -- | None Listed On Document | |
| Andersen Lyle Rex | -- | None Available |
Source: Public Records
Mortgage History
| Date | Status | Borrower | Loan Amount |
|---|---|---|---|
| Open | Andersen Lyle Rex | $50,000 | |
| Previous Owner | Andersen Lyle Rex | $110,000 |
Source: Public Records
Tax History Compared to Growth
Tax History
| Year | Tax Paid | Tax Assessment Tax Assessment Total Assessment is a certain percentage of the fair market value that is determined by local assessors to be the total taxable value of land and additions on the property. | Land | Improvement |
|---|---|---|---|---|
| 2025 | $2,071 | $590,754 | $97,492 | $493,262 |
| 2024 | $2,071 | $594,794 | $97,492 | $497,302 |
| 2023 | $1,771 | $473,712 | $99,762 | $373,950 |
| 2022 | $2,063 | $418,418 | $64,298 | $354,120 |
| 2021 | $1,959 | $299,477 | $58,407 | $241,070 |
| 2019 | $1,996 | $268,470 | $50,700 | $217,770 |
| 2018 | $1,826 | $263,786 | $37,736 | $226,050 |
| 2017 | $1,697 | $244,152 | $36,542 | $207,610 |
| 2016 | $1,697 | $235,459 | $33,239 | $202,220 |
| 2015 | $1,658 | $223,599 | $33,239 | $190,360 |
| 2014 | $18,233 | $223,599 | $33,239 | $190,360 |
| 2013 | $1,333 | $187,268 | $33,238 | $154,030 |
Source: Public Records
Map
Nearby Homes
- 3654 E Beretta Ave
- 3713 E Hyrum Dr
- 4197 N Bristol Dr
- 3758 Slate Dr
- 4197 N Dudley Ave
- 4348 N Harley Dr
- 4343 N Ruger Dr
- 3886 E Ridgeland Dr
- 3867 E Hyrum Dr
- 3586 E Iona Rd
- 3487 Jade St
- 3762 E Marble Dr
- 3670 N Rain Tree St
- 3894 E Marble Dr
- 3201 Golden Rod Dr
- 4628 N Weatherby Way
- 4649 Weatherby Way
- 4681 Memory Ln
- 4702 N Weatherby Way
- 2950 N Ammon Rd
- 3973 Joshua Ln
- 3541 Terra Cotta Ct
- 3969 Joshua Ln
- 3553 Terra Cotta Ct
- 3967 Joshua Ln
- 3987 Joshua Ln
- 3984 Joshua Ln
- 3571 Terra Cotta Ct
- 3571 E Terra Cotta Cir
- 3855 N Ammon Rd
- 3980 Joshua Ln
- 3550 E Terra Cotta Cir
- 3925 N Ammon Rd
- 3540 Terra Cotta Ct
- 3992 Joshua Ln
- 3554 E Terra Cotta Cir
- 3554 Terra Cotta Ct
- 3975 Flaming Rock Rd
- 3965 N Ammon Rd