Estimated Value: $906,000 - $1,010,000
5
Beds
4
Baths
2,509
Sq Ft
$385/Sq Ft
Est. Value
About This Home
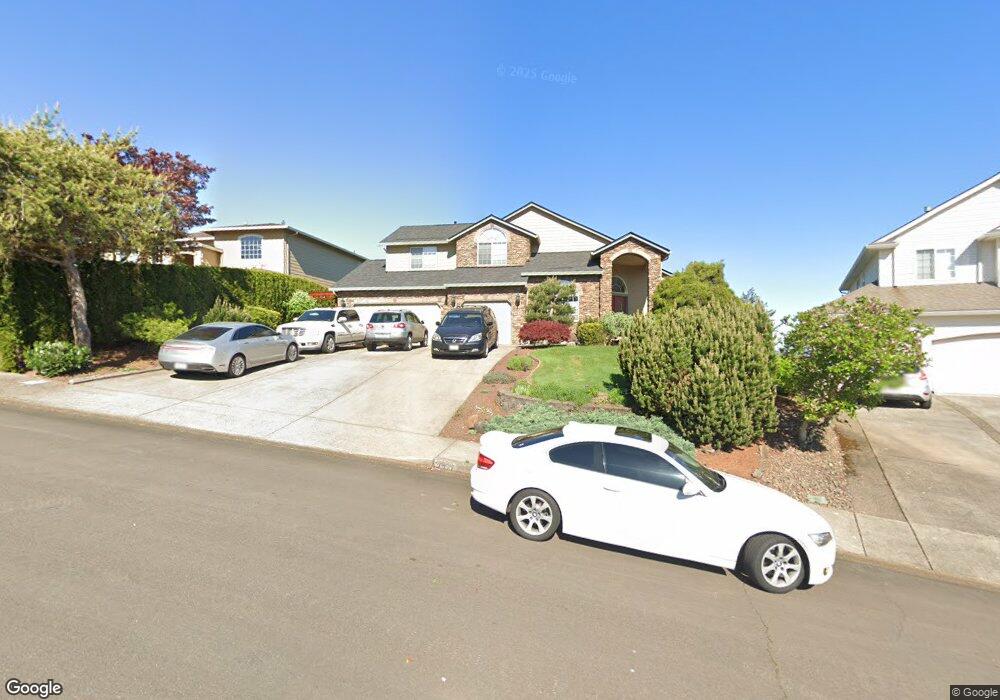
This home is located at 3971 NW Currawong Ct, Camas, WA 98607 and is currently estimated at $964,892, approximately $384 per square foot. 3971 NW Currawong Ct is a home located in Clark County with nearby schools including Helen Baller Elementary School, Liberty Middle School, and Camas High School.
Ownership History
Date
Name
Owned For
Owner Type
Purchase Details
Closed on
Oct 26, 2023
Sold by
Voiculescu Cristian V and Voiculescu Tuyet-Le
Bought by
Voiculescu Family Trust and Voiculescu
Current Estimated Value
Purchase Details
Closed on
Apr 24, 2020
Sold by
Voiculescu Nicolac and Voiculescu Dumitra
Bought by
Voiculescu Cristian V and Voiculescu Tuyet Le
Home Financials for this Owner
Home Financials are based on the most recent Mortgage that was taken out on this home.
Original Mortgage
$381,000
Interest Rate
3.6%
Mortgage Type
New Conventional
Purchase Details
Closed on
Feb 24, 2000
Sold by
Cascade West Development Inc
Bought by
Voiculescu Nicolae and Voiculescu Dumitra
Home Financials for this Owner
Home Financials are based on the most recent Mortgage that was taken out on this home.
Original Mortgage
$313,500
Interest Rate
6.5%
Purchase Details
Closed on
Jul 2, 1999
Sold by
Messinger Eric P and Messinger Joanne L
Bought by
Cascade West Development Inc
Create a Home Valuation Report for This Property
The Home Valuation Report is an in-depth analysis detailing your home's value as well as a comparison with similar homes in the area
Home Values in the Area
Average Home Value in this Area
Purchase History
| Date | Buyer | Sale Price | Title Company |
|---|---|---|---|
| Voiculescu Family Trust | $313 | None Listed On Document | |
| Voiculescu Cristian V | -- | Chicago Title Vancouver | |
| Voiculescu Nicolae | $383,921 | Chicago Title Insurance Co | |
| Cascade West Development Inc | -- | Chicago Title Insurance Co |
Source: Public Records
Mortgage History
| Date | Status | Borrower | Loan Amount |
|---|---|---|---|
| Previous Owner | Voiculescu Cristian V | $381,000 | |
| Previous Owner | Voiculescu Nicolae | $313,500 |
Source: Public Records
Tax History Compared to Growth
Tax History
| Year | Tax Paid | Tax Assessment Tax Assessment Total Assessment is a certain percentage of the fair market value that is determined by local assessors to be the total taxable value of land and additions on the property. | Land | Improvement |
|---|---|---|---|---|
| 2025 | $8,366 | $840,907 | $215,000 | $625,907 |
| 2024 | $8,823 | $877,923 | $283,000 | $594,923 |
| 2023 | $8,104 | $995,756 | $295,580 | $700,176 |
| 2022 | $7,872 | $869,592 | $262,770 | $606,822 |
| 2021 | $8,103 | $706,025 | $218,400 | $487,625 |
| 2020 | $8,694 | $673,456 | $215,000 | $458,456 |
| 2019 | $7,772 | $670,115 | $215,000 | $455,115 |
| 2018 | $8,438 | $638,059 | $0 | $0 |
| 2017 | $7,471 | $582,309 | $0 | $0 |
| 2016 | $7,130 | $561,458 | $0 | $0 |
| 2015 | $7,185 | $533,170 | $0 | $0 |
| 2014 | -- | $506,621 | $0 | $0 |
| 2013 | -- | $457,547 | $0 | $0 |
Source: Public Records
Map
Nearby Homes
- 2112 NW 42nd Ave
- 3313 NW Sierra Dr
- 0 Parklands Lot (East) Unit NWM2403716
- 0 NW Parkland Lot (Middle) Unit NWM2403721
- 0 NW Parklands Lot (West) Unit NWM2403728
- 1610 NW 34th Ave
- 4030 NW Dahlia Dr
- 4000 NW Dahlia Dr
- 1402 NW 30th Ave
- 3015 NW Vanguard Place
- 3113 NW Pacific Rim Dr
- 4241 NW Grass Valley Ct
- 2720 NW 30th Cir
- 4945 N Adams Ct
- 2845 N 48th Ave
- 2712 N 48th Ave
- Cushman with Basement Plan at Lacamas Hills - Powell Collection
- Cultus Plan at Lacamas Hills - Huron Collection
- Suttle Plan at Lacamas Hills - Huron Collection
- Quinault with Basement Plan at Lacamas Hills - Huron Collection
- 3981 NW Currawong Ct
- 3957 NW Currawong Ct
- 1742 NW 40th Ave
- 3949 NW Currawong Ct
- 3993 NW Currawong Ct
- 3950 NW Sierra Dr
- 4031 NW Sierra Dr
- 3964 NW Currawong Ct
- 4023 NW Sierra Dr
- 4041 NW Sierra Dr
- 3984 NW Currawong Ct
- 3942 NW Currawong Ct
- 4051 NW Sierra Dr
- 3936 NW Sierra Dr
- 3933 NW Currawong Ct
- 4059 NW Sierra Dr
- 1712 NW 40th Ave
- 1921 NW 40th Ave
- 3924 NW Currawong Ct
- 3959 NW Sierra Dr