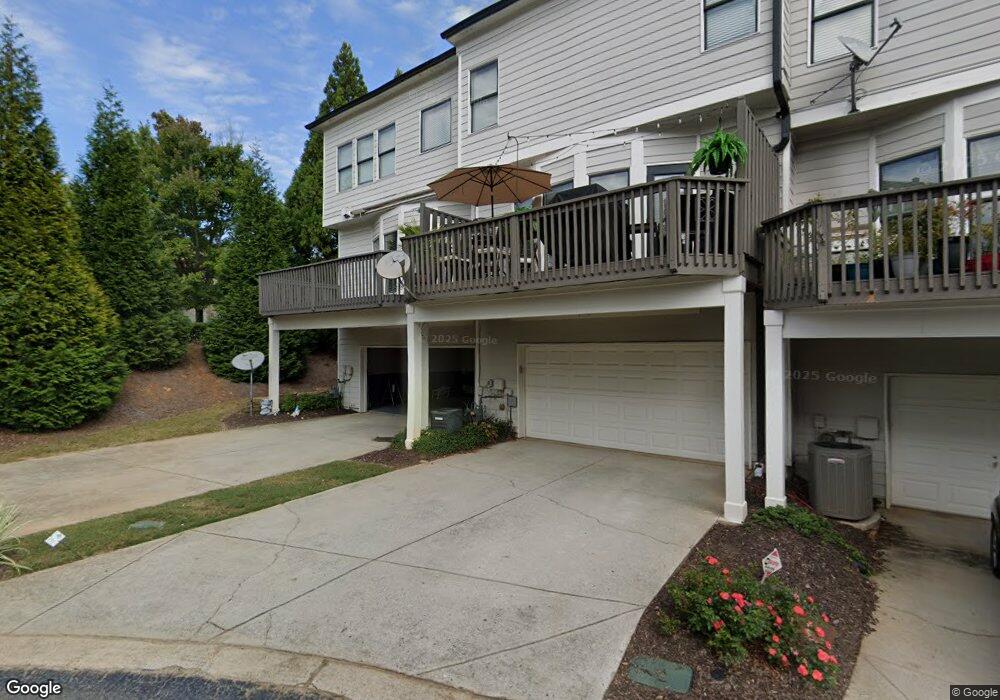
3971 Savannah Square St NW Suwanee, GA 30024
Estimated Value: $489,000 - $522,709
2
Beds
3
Baths
2,224
Sq Ft
$227/Sq Ft
Est. Value
About This Home
This home is located at 3971 Savannah Square St NW, Suwanee, GA 30024 and is currently estimated at $505,177, approximately $227 per square foot. 3971 Savannah Square St NW is a home located in Gwinnett County with nearby schools including North Gwinnett Middle School, North Gwinnett High School, and Old Suwanee Christian School.
Ownership History
Date
Name
Owned For
Owner Type
Purchase Details
Closed on
Jun 30, 2022
Sold by
Cline Thomas
Bought by
Renwick Jennifer
Current Estimated Value
Home Financials for this Owner
Home Financials are based on the most recent Mortgage that was taken out on this home.
Original Mortgage
$344,000
Outstanding Balance
$326,320
Interest Rate
5.09%
Mortgage Type
New Conventional
Estimated Equity
$178,857
Purchase Details
Closed on
Aug 28, 2015
Sold by
Hesson Arthur J
Bought by
Cline Elizabeth and Cline Sherri
Home Financials for this Owner
Home Financials are based on the most recent Mortgage that was taken out on this home.
Original Mortgage
$183,600
Interest Rate
4.16%
Purchase Details
Closed on
Aug 31, 2005
Sold by
Bowen Family Homes Inc
Bought by
Hesson Arthur J and Hesson Lenora
Home Financials for this Owner
Home Financials are based on the most recent Mortgage that was taken out on this home.
Original Mortgage
$213,353
Interest Rate
5.72%
Mortgage Type
VA
Create a Home Valuation Report for This Property
The Home Valuation Report is an in-depth analysis detailing your home's value as well as a comparison with similar homes in the area
Home Values in the Area
Average Home Value in this Area
Purchase History
| Date | Buyer | Sale Price | Title Company |
|---|---|---|---|
| Renwick Jennifer | $430,000 | -- | |
| Cline Elizabeth | $229,500 | -- | |
| Hesson Arthur J | $216,800 | -- |
Source: Public Records
Mortgage History
| Date | Status | Borrower | Loan Amount |
|---|---|---|---|
| Open | Renwick Jennifer | $344,000 | |
| Previous Owner | Cline Elizabeth | $183,600 | |
| Previous Owner | Hesson Arthur J | $213,353 |
Source: Public Records
Tax History Compared to Growth
Tax History
| Year | Tax Paid | Tax Assessment Tax Assessment Total Assessment is a certain percentage of the fair market value that is determined by local assessors to be the total taxable value of land and additions on the property. | Land | Improvement |
|---|---|---|---|---|
| 2025 | $6,457 | $204,320 | $30,000 | $174,320 |
| 2024 | $6,351 | $198,480 | $29,600 | $168,880 |
| 2023 | $6,351 | $172,000 | $29,600 | $142,400 |
| 2022 | $6,267 | $168,280 | $29,600 | $138,680 |
| 2021 | $4,977 | $131,920 | $19,640 | $112,280 |
| 2020 | $4,058 | $123,920 | $18,240 | $105,680 |
| 2019 | $3,440 | $123,920 | $18,240 | $105,680 |
| 2018 | $3,180 | $111,120 | $24,000 | $87,120 |
| 2016 | $2,761 | $91,800 | $24,000 | $67,800 |
| 2015 | $2,621 | $83,880 | $18,400 | $65,480 |
| 2014 | -- | $83,880 | $18,400 | $65,480 |
Source: Public Records
Map
Nearby Homes
- 3971 Savannah Square St
- 320 Town Center Ave Unit 206
- 350 Suwanee Ave
- 3908 Charleston Market St
- 3862 Memphis Dr
- 3793 Memphis Dr
- 212 Suwanee Ave
- 3779 Lawrenceville Suwanee
- 0 Mohawk Trail Unit 10607084
- 0 Mary Lou St Unit 7445497
- 0 Mary Lou St Unit 10365827
- 3894 Dollar Cir
- 524 Cypher Dr
- 3764 Sage Park Way
- 2459 Richmond Row Dr
- 645 Stonepark Ln
- The Murray Plan at Old Town Suwanee
- The Telfair Plan at Old Town Suwanee
- 4080 Cherry Ridge Walk Unit 1
- 3540 Pierce Arrow Cir Unit 2
- 3969 Savannah Square St
- 3967 Savannah Square St
- 3965 Savannah Square St
- 3965 Savannah Square St Unit 198
- 3963 Savannah Square St
- 3941 Savannah Square St
- 3961 Savannah Square St NW
- 3961 Savannah Square St Unit 3961
- 3961 Savannah Square St
- 3961 Savannah Square St Unit 2
- 3941 Savannah Square St NW
- 3939 N Savannah St
- 3939 Savannah Square St NW
- 3939 Savannah Square St
- 3937 Savannah Square St
- 3959 Savannah Square St
- 3959 Savannah Square
- 3976 Boston Common St Unit 3976
- 3976 Boston Common St
- 3970 Boston Common St NW