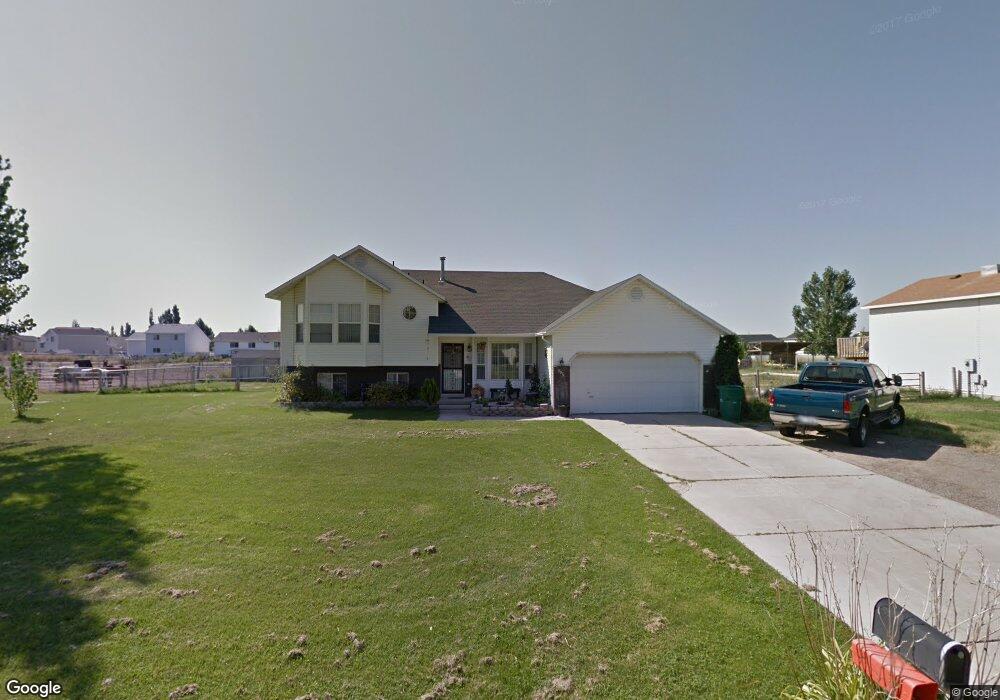
3971 W 4550 S West Haven, UT 84401
Estimated Value: $541,000 - $600,000
4
Beds
3
Baths
1,472
Sq Ft
$384/Sq Ft
Est. Value
About This Home
This home is located at 3971 W 4550 S, West Haven, UT 84401 and is currently estimated at $565,151, approximately $383 per square foot. 3971 W 4550 S is a home located in Weber County with nearby schools including West Haven School, Sand Ridge Junior High School, and Roy High School.
Ownership History
Date
Name
Owned For
Owner Type
Purchase Details
Closed on
Feb 14, 2020
Sold by
Miler Sheryl L
Bought by
Miller Sheryl L and Sheryl Miller Revocable Trust
Current Estimated Value
Purchase Details
Closed on
Apr 20, 2007
Sold by
Miller Leonel W and Miller Sheryl L
Bought by
Miller Sheryl L
Home Financials for this Owner
Home Financials are based on the most recent Mortgage that was taken out on this home.
Original Mortgage
$176,250
Outstanding Balance
$106,331
Interest Rate
6.11%
Mortgage Type
Stand Alone Refi Refinance Of Original Loan
Estimated Equity
$458,820
Purchase Details
Closed on
Jul 8, 1996
Sold by
Peterson Melvin L and Sessions Scott C
Bought by
Miller Leonel W
Home Financials for this Owner
Home Financials are based on the most recent Mortgage that was taken out on this home.
Original Mortgage
$116,000
Interest Rate
8.03%
Mortgage Type
Purchase Money Mortgage
Create a Home Valuation Report for This Property
The Home Valuation Report is an in-depth analysis detailing your home's value as well as a comparison with similar homes in the area
Home Values in the Area
Average Home Value in this Area
Purchase History
| Date | Buyer | Sale Price | Title Company |
|---|---|---|---|
| Miller Sheryl L | -- | None Available | |
| Miller Sheryl L | -- | Bonneville Superior Title Co | |
| Miller Leonel W | -- | Bonneville Title |
Source: Public Records
Mortgage History
| Date | Status | Borrower | Loan Amount |
|---|---|---|---|
| Open | Miller Sheryl L | $176,250 | |
| Closed | Miller Leonel W | $116,000 |
Source: Public Records
Tax History Compared to Growth
Tax History
| Year | Tax Paid | Tax Assessment Tax Assessment Total Assessment is a certain percentage of the fair market value that is determined by local assessors to be the total taxable value of land and additions on the property. | Land | Improvement |
|---|---|---|---|---|
| 2025 | $3,549 | $523,542 | $173,322 | $350,220 |
| 2024 | $3,373 | $283,249 | $95,327 | $187,922 |
| 2023 | $3,474 | $297,550 | $95,327 | $202,223 |
| 2022 | $3,388 | $300,850 | $95,327 | $205,523 |
| 2021 | $2,984 | $430,000 | $87,382 | $342,618 |
| 2020 | $2,835 | $383,000 | $72,475 | $310,525 |
| 2019 | $2,678 | $345,000 | $74,620 | $270,380 |
| 2018 | $2,501 | $312,000 | $60,542 | $251,458 |
| 2017 | $2,429 | $286,000 | $63,127 | $222,873 |
| 2016 | $2,095 | $135,619 | $28,076 | $107,543 |
| 2015 | $2,030 | $130,498 | $28,076 | $102,422 |
| 2014 | $1,867 | $117,920 | $28,076 | $89,844 |
Source: Public Records
Map
Nearby Homes
- 4024 W 4650 S
- 4094 W 4700 S
- 4097 W 4750 S
- 3692 W 4625 S
- 4106 W 4875 S
- 3671 W 4700 S
- 3652 W 4625 S
- Villages Townhome Plan at Green Farm - Villages
- 3632 W 4650 S
- 4890 S 4075 W
- 4141 W 4875 S
- 3627 W 4650 S
- 4756 S 4300 W
- 4990 S 4075 W
- 4021 W 5000 S
- 3820 Foxglen Dr
- 3610 W 4475 S
- Poplar Plan at Highgate Cove
- Pando Plan at Highgate Cove
- 5013 S 4150 W