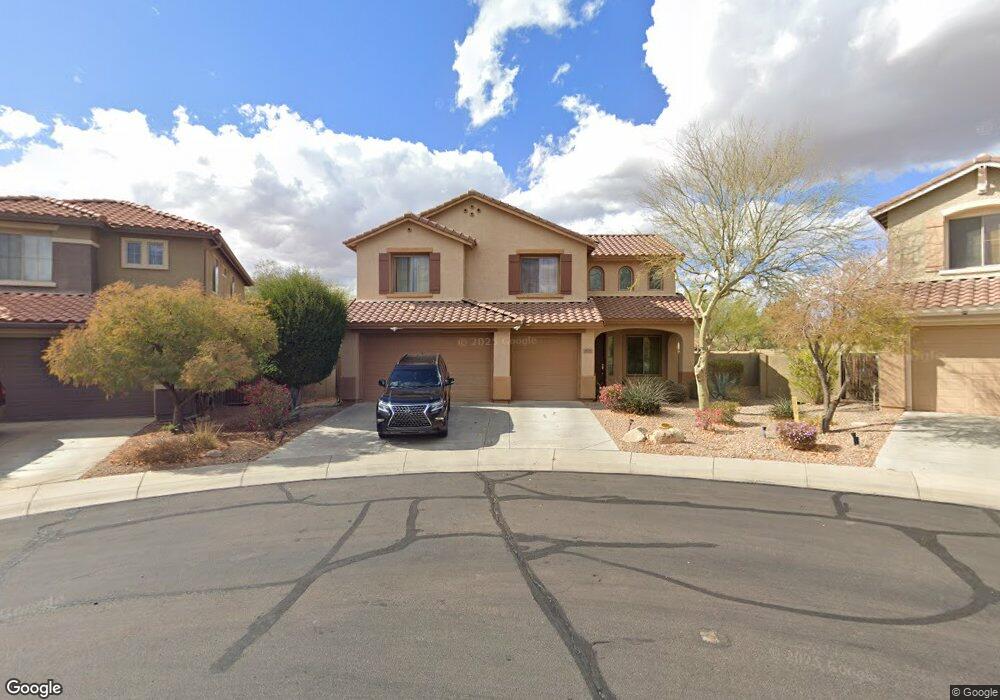
39730 N Rolling Green Way Unit 51 Anthem, AZ 85086
Estimated Value: $627,911 - $763,000
--
Bed
4
Baths
2,968
Sq Ft
$233/Sq Ft
Est. Value
About This Home
This home is located at 39730 N Rolling Green Way Unit 51, Anthem, AZ 85086 and is currently estimated at $692,978, approximately $233 per square foot. 39730 N Rolling Green Way Unit 51 is a home located in Maricopa County with nearby schools including Diamond Canyon Elementary School and Boulder Creek High School.
Ownership History
Date
Name
Owned For
Owner Type
Purchase Details
Closed on
Sep 29, 2011
Sold by
Chlaiwit Faysal Dawahra and Dawahra Mariam Shleweit
Bought by
Dawahra Faysal and Dawahra Mariam
Current Estimated Value
Home Financials for this Owner
Home Financials are based on the most recent Mortgage that was taken out on this home.
Original Mortgage
$255,100
Outstanding Balance
$100,537
Interest Rate
4.09%
Mortgage Type
New Conventional
Estimated Equity
$592,441
Purchase Details
Closed on
Oct 13, 2004
Sold by
Del Webbs Coventry Homes Inc
Bought by
Chlaiwit Faysal Dawahra and Dawahra Mariam Shleweit
Home Financials for this Owner
Home Financials are based on the most recent Mortgage that was taken out on this home.
Original Mortgage
$281,995
Interest Rate
5.72%
Mortgage Type
New Conventional
Create a Home Valuation Report for This Property
The Home Valuation Report is an in-depth analysis detailing your home's value as well as a comparison with similar homes in the area
Home Values in the Area
Average Home Value in this Area
Purchase History
| Date | Buyer | Sale Price | Title Company |
|---|---|---|---|
| Dawahra Faysal | -- | Security Title Agency | |
| Chlaiwit Faysal Dawahra | $352,494 | Sun Title Agency Co | |
| Del Webbs Coventry Homes Inc | -- | Sun Title Agency Co |
Source: Public Records
Mortgage History
| Date | Status | Borrower | Loan Amount |
|---|---|---|---|
| Open | Dawahra Faysal | $255,100 | |
| Closed | Chlaiwit Faysal Dawahra | $281,995 |
Source: Public Records
Tax History Compared to Growth
Tax History
| Year | Tax Paid | Tax Assessment Tax Assessment Total Assessment is a certain percentage of the fair market value that is determined by local assessors to be the total taxable value of land and additions on the property. | Land | Improvement |
|---|---|---|---|---|
| 2025 | $3,733 | $34,636 | -- | -- |
| 2024 | $3,498 | $32,987 | -- | -- |
| 2023 | $3,498 | $47,330 | $9,460 | $37,870 |
| 2022 | $3,343 | $34,620 | $6,920 | $27,700 |
| 2021 | $3,443 | $33,370 | $6,670 | $26,700 |
| 2020 | $3,367 | $31,020 | $6,200 | $24,820 |
| 2019 | $3,303 | $29,230 | $5,840 | $23,390 |
| 2018 | $3,199 | $28,120 | $5,620 | $22,500 |
| 2017 | $3,136 | $27,400 | $5,480 | $21,920 |
| 2016 | $2,816 | $27,420 | $5,480 | $21,940 |
| 2015 | $2,609 | $25,560 | $5,110 | $20,450 |
Source: Public Records
Map
Nearby Homes
- 2116 W Kuralt Dr
- 2237 W Twain Dr Unit 39
- 2251 W Clearview Trail Unit 49
- 2030 W Clearview Trail Unit 51
- 39519 N Rolling Green Ct
- 39709 N Lost Legend Dr Unit 51
- 40128 N Hickok Trail Unit 29
- 40114 N Noble Hawk Ct
- 1927 W Kuralt Dr Unit 53
- 2407 W Warren Dr Unit 35
- 2456 W Clearview Trail Unit 47
- 1821 W Kuralt Dr Unit 53
- 39826 N Mill Creek Ct Unit 43
- 40131 N Mill Creek Way
- 2403 W Kit Carson Ct Unit 25
- 1873 W Owens Way
- 40614 N Laurel Valley Way Unit 37
- 39029 N 21st Ave
- 40420 N Chase Oaks Way Unit 25
- 1730 W Hemingway Ln
- 2134 W Kuralt Dr
- 39724 N Rolling Green Way
- 39807 N Belfair Way Unit ID1247229P
- 39807 N Belfair Way
- 39801 N Belfair Way
- 39718 N Rolling Green Way Unit 51
- 39813 N Belfair Way
- 2159 W Clearview Trail
- 2128 W Kuralt Dr
- 2128 W Kuralt Dr Unit 16
- 39717 N Belfair Way Unit 49
- 2153 W Clearview Trail
- 2131 W Kuralt Dr Unit 51
- 39712 N Rolling Green Way Unit 51
- 39817 N Belfair Way Unit 49
- 2122 W Kuralt Dr Unit 51
- 2147 W Clearview Trail
- 39711 N Belfair Way
- 2125 W Kuralt Dr
- 2141 W Clearview Trail