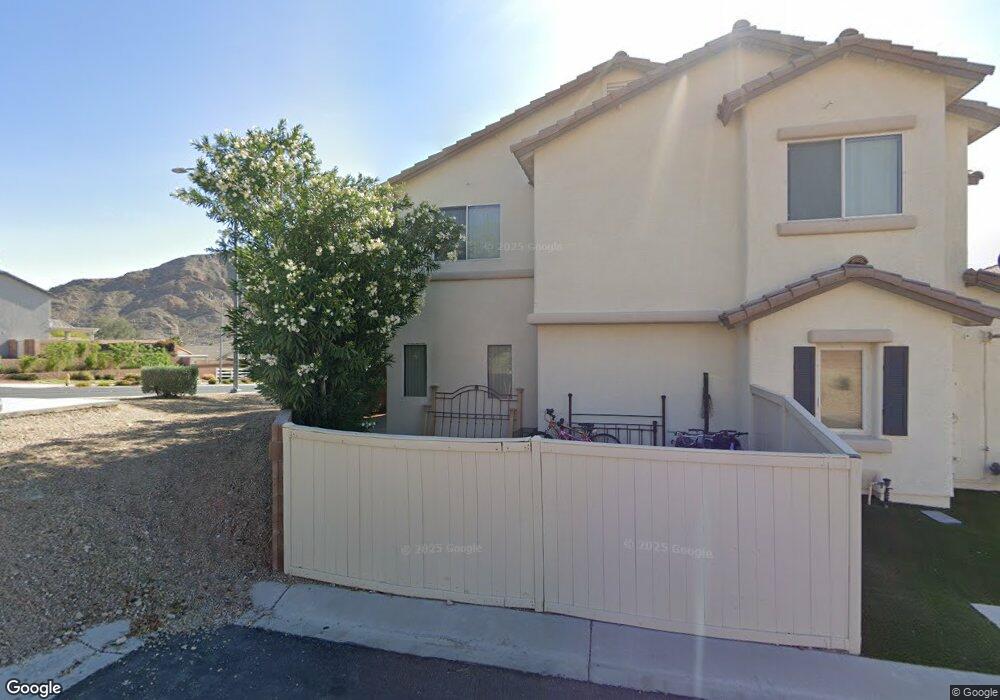
3976 Badgerbrook St Las Vegas, NV 89129
Lone Mountain NeighborhoodEstimated Value: $379,000 - $421,000
3
Beds
3
Baths
1,937
Sq Ft
$208/Sq Ft
Est. Value
About This Home
This home is located at 3976 Badgerbrook St, Las Vegas, NV 89129 and is currently estimated at $402,177, approximately $207 per square foot. 3976 Badgerbrook St is a home located in Clark County with nearby schools including Eileen Conners Elementary School, Justice Myron E Leavitt Middle School, and Centennial High School.
Ownership History
Date
Name
Owned For
Owner Type
Purchase Details
Closed on
Jun 7, 2008
Sold by
Gamble Tarena
Bought by
Gamble Justin
Current Estimated Value
Purchase Details
Closed on
Jun 5, 2008
Sold by
Us Bank Na
Bought by
Gamble Justin
Purchase Details
Closed on
Jun 1, 2007
Sold by
Martinez Orlando Paul and Martinez Tina L
Bought by
Us Bank Na
Purchase Details
Closed on
Aug 18, 2003
Sold by
Richmond American Homes Of Nevada Inc
Bought by
Martinez Orlando Paul and Martinez Tina L
Home Financials for this Owner
Home Financials are based on the most recent Mortgage that was taken out on this home.
Original Mortgage
$176,200
Interest Rate
5.46%
Mortgage Type
Unknown
Create a Home Valuation Report for This Property
The Home Valuation Report is an in-depth analysis detailing your home's value as well as a comparison with similar homes in the area
Home Values in the Area
Average Home Value in this Area
Purchase History
| Date | Buyer | Sale Price | Title Company |
|---|---|---|---|
| Gamble Justin | -- | Chicago Title | |
| Gamble Justin | $150,000 | Chicago Title | |
| Us Bank Na | $292,500 | None Available | |
| Martinez Orlando Paul | $176,225 | Stewart Title Of Nevada |
Source: Public Records
Mortgage History
| Date | Status | Borrower | Loan Amount |
|---|---|---|---|
| Previous Owner | Martinez Orlando Paul | $176,200 |
Source: Public Records
Tax History Compared to Growth
Tax History
| Year | Tax Paid | Tax Assessment Tax Assessment Total Assessment is a certain percentage of the fair market value that is determined by local assessors to be the total taxable value of land and additions on the property. | Land | Improvement |
|---|---|---|---|---|
| 2025 | $2,683 | $106,487 | $31,850 | $74,637 |
| 2024 | $2,432 | $106,487 | $31,850 | $74,637 |
| 2023 | $2,432 | $100,242 | $29,750 | $70,492 |
| 2022 | $1,829 | $87,827 | $23,450 | $64,377 |
| 2021 | $1,693 | $82,209 | $21,000 | $61,209 |
| 2020 | $1,570 | $81,671 | $21,000 | $60,671 |
| 2019 | $1,471 | $77,760 | $18,200 | $59,560 |
| 2018 | $1,404 | $71,299 | $14,333 | $56,966 |
| 2017 | $2,303 | $70,251 | $12,600 | $57,651 |
| 2016 | $1,816 | $58,959 | $10,150 | $48,809 |
| 2015 | $1,619 | $49,597 | $8,400 | $41,197 |
| 2014 | $1,381 | $40,661 | $5,250 | $35,411 |
Source: Public Records
Map
Nearby Homes
- 3929 Philomena St
- 3908 Badgerbrook St
- 10365 Cherokee Corner Ave
- 10425 Denali Ridge Ct
- 3945 Bayamon St
- 3935 Legend Hills St Unit 104
- 10290 Gilmore Canyon Ct Unit 103
- 4033 Baxter Peak St
- 10429 Chandra Ave
- 3920 Legend Hills St Unit 202
- 3930 Legend Hills St Unit 102
- 3908 Total Eclipse St
- 10400 Coyote Cub Ave
- 10404 Coyote Cub Ave
- 3915 Palm Beach St Unit 201
- 10476 Wellington Manor Ave Unit 5
- 10231 Delray Beach Ave Unit 201
- 10544 Headwind Ave
- 10221 Delray Beach Ave Unit 201
- 10413 Cole Younger Ct
- 3972 Badgerbrook St
- 3968 Badgerbrook St
- 3964 Badgerbrook St
- 10428 Concetta Ave
- 10428 Concetta Ave Unit n/a
- 3956 Badgerbrook St Unit n/a
- 10424 Concetta Ave
- 3961 Philomena St
- 3965 Philomena St
- 10432 Concetta Ave
- 10436 Concetta Ave
- 10425 Concetta Ave
- 3949 Philomena St
- 3952 Badgerbrook St
- 3948 Badgerbrook St
- 4004 Driscoll Mountain St
- 3957 Philomena St
- 3945 Philomena St
- 3969 Philomena St