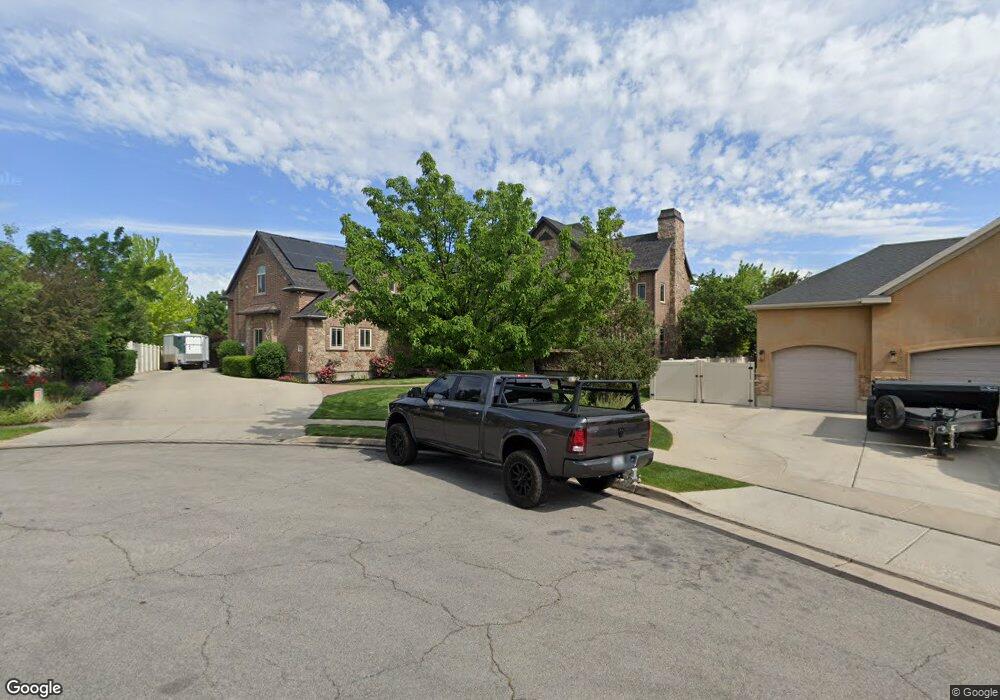
3976 Farrell Ln West Jordan, UT 84088
Jordan Oaks NeighborhoodEstimated Value: $1,089,000 - $1,225,117
5
Beds
4
Baths
7,286
Sq Ft
$160/Sq Ft
Est. Value
About This Home
This home is located at 3976 Farrell Ln, West Jordan, UT 84088 and is currently estimated at $1,164,039, approximately $159 per square foot. 3976 Farrell Ln is a home located in Salt Lake County with nearby schools including Terra Linda Elementary School, Elk Ridge Middle School, and West Jordan High School.
Ownership History
Date
Name
Owned For
Owner Type
Purchase Details
Closed on
Oct 22, 2021
Sold by
Baird Hal D
Bought by
Baird Hal and Baird Shari
Current Estimated Value
Home Financials for this Owner
Home Financials are based on the most recent Mortgage that was taken out on this home.
Original Mortgage
$890,000
Outstanding Balance
$811,597
Interest Rate
2.8%
Mortgage Type
VA
Estimated Equity
$352,442
Purchase Details
Closed on
Mar 16, 2020
Sold by
Baird Hal D and Baird Shari G
Bought by
Baird Hal and Baird Shari
Home Financials for this Owner
Home Financials are based on the most recent Mortgage that was taken out on this home.
Original Mortgage
$619,300
Interest Rate
3.4%
Mortgage Type
VA
Purchase Details
Closed on
Oct 31, 2014
Sold by
Baird Hal D and Baird Shari G
Bought by
Baird Hal D and Baird Shari G
Purchase Details
Closed on
Dec 15, 2009
Sold by
Taylor Bean & Whitaker Mortgage Corp
Bought by
Baird Hal D and Baird Shari G
Home Financials for this Owner
Home Financials are based on the most recent Mortgage that was taken out on this home.
Original Mortgage
$300,002
Interest Rate
4.91%
Mortgage Type
New Conventional
Purchase Details
Closed on
Jul 23, 2009
Sold by
Mccrady Scott E and Mccrady Carrie L
Bought by
Taylor Bean & Whitaker Mortgage Corp
Purchase Details
Closed on
Mar 14, 2007
Sold by
Naylor Farms Estates Llc
Bought by
Deseret Sky Development Llc
Home Financials for this Owner
Home Financials are based on the most recent Mortgage that was taken out on this home.
Original Mortgage
$635,500
Interest Rate
6.29%
Mortgage Type
Construction
Purchase Details
Closed on
Mar 8, 2007
Sold by
Naylor Farms Estates Llc
Bought by
Deseret Sky Development Llc
Home Financials for this Owner
Home Financials are based on the most recent Mortgage that was taken out on this home.
Original Mortgage
$635,500
Interest Rate
6.29%
Mortgage Type
Construction
Purchase Details
Closed on
Mar 5, 2007
Sold by
Deseret Sky Development Llc
Bought by
Mccrady Scott E and Mccrady Carrie L
Home Financials for this Owner
Home Financials are based on the most recent Mortgage that was taken out on this home.
Original Mortgage
$635,500
Interest Rate
6.29%
Mortgage Type
Construction
Purchase Details
Closed on
Nov 16, 2006
Sold by
Naylor Farms Estates Llc
Bought by
Deseret Sky Development Llc
Create a Home Valuation Report for This Property
The Home Valuation Report is an in-depth analysis detailing your home's value as well as a comparison with similar homes in the area
Home Values in the Area
Average Home Value in this Area
Purchase History
| Date | Buyer | Sale Price | Title Company |
|---|---|---|---|
| Baird Hal | -- | Accommodation | |
| Baird Hal D | -- | Capstone Title & Escrow | |
| Baird Hal | -- | First American Title Ut Co | |
| Baird Hal D | -- | None Available | |
| Baird Hal D | $505,002 | United Title Services | |
| Taylor Bean & Whitaker Mortgage Corp | $661,431 | Etitle Insurance Agency | |
| Deseret Sky Development Llc | -- | Brighton Title | |
| Deseret Sky Development Llc | -- | Brighton Title | |
| Mccrady Scott E | -- | Brighton Title | |
| Deseret Sky Development Llc | -- | Accommodation |
Source: Public Records
Mortgage History
| Date | Status | Borrower | Loan Amount |
|---|---|---|---|
| Open | Baird Hal D | $890,000 | |
| Closed | Baird Hal | $619,300 | |
| Closed | Baird Hal D | $300,002 | |
| Previous Owner | Mccrady Scott E | $635,500 |
Source: Public Records
Tax History Compared to Growth
Tax History
| Year | Tax Paid | Tax Assessment Tax Assessment Total Assessment is a certain percentage of the fair market value that is determined by local assessors to be the total taxable value of land and additions on the property. | Land | Improvement |
|---|---|---|---|---|
| 2025 | $608 | $1,152,800 | $192,700 | $960,100 |
| 2024 | $608 | $1,036,200 | $178,900 | $857,300 |
| 2023 | $699 | $998,500 | $173,700 | $824,800 |
| 2022 | $2,779 | $1,012,000 | $170,300 | $841,700 |
| 2021 | $1,642 | $767,900 | $130,100 | $637,800 |
| 2020 | $1,416 | $709,800 | $125,900 | $583,900 |
| 2019 | $1,385 | $691,900 | $125,900 | $566,000 |
| 2018 | $1,268 | $661,400 | $139,900 | $521,500 |
| 2017 | $1,104 | $627,100 | $114,500 | $512,600 |
| 2016 | $1,215 | $629,000 | $114,500 | $514,500 |
| 2015 | $927 | $583,700 | $116,600 | $467,100 |
| 2014 | $2,002 | $533,000 | $107,900 | $425,100 |
Source: Public Records
Map
Nearby Homes
- 3750 W Bingham Creek Dr
- 9375 S Laurel Ridge Cir
- 3931 W Dansere Cir
- 8941 S Sun Leaf Dr
- 3702 W Angus Dr
- 3888 W 8700 S
- 9441 S Newkirk St
- 9029 S Ripple Dr
- 9353 S 4460 W
- 9526 Ember Glow Ct Unit C
- 9566 Ember Glow Ct Unit C
- 8400 S 4000 W Unit 134
- 4624 Pine Crossing Dr
- 4565 Lennox Dr
- 4424 W Skye Dr
- 8461 S Meadowlark Ln
- 4707 W Granada Hills Ct
- 9871 S 4000 W
- 3214 W Monterey Pine Ln
- 3965 Dundee St
- 3972 Farrell Ln
- 3972 W Farrell Ln
- 9134 S Farrell Ln
- 9134 S Farrell Ln
- 3958 W Farrell Ln
- 9115 Wind River Cir
- 9142 Farrell Ln
- 9142 S Farrell Ln
- 9125 Wind River Cir
- 3961 W Farrell Ln
- 3961 Farrell Ln
- 3961 W 9000 S
- 4016 Wind River Dr
- 3949 W Farrell Ln
- 3949 Farrell Ln
- 3946 W Farrell Ln
- 9138 Wind River Cir
- 3946 W Farrell Ln
- 3946 W Farrell Ln Unit 7
- 9156 Farrell Ln