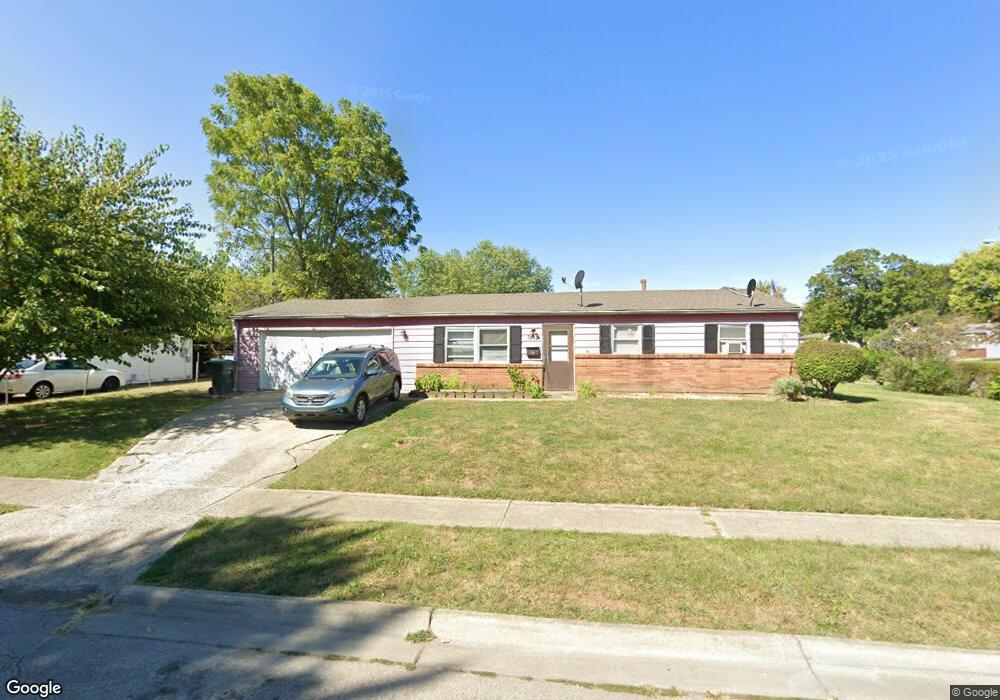
3979 Carlton Ave Columbus, OH 43227
Leawood NeighborhoodEstimated Value: $161,348 - $195,000
3
Beds
1
Bath
988
Sq Ft
$179/Sq Ft
Est. Value
About This Home
This home is located at 3979 Carlton Ave, Columbus, OH 43227 and is currently estimated at $176,837, approximately $178 per square foot. 3979 Carlton Ave is a home located in Franklin County with nearby schools including Leawood Elementary School, Sherwood Middle School, and Walnut Ridge High School.
Ownership History
Date
Name
Owned For
Owner Type
Purchase Details
Closed on
Apr 16, 2009
Sold by
Dynamic Property Solutions Llc
Bought by
Wehinger Mark
Current Estimated Value
Purchase Details
Closed on
Apr 9, 2009
Sold by
Wells Fargo Bank Na
Bought by
Dynamic Property Solutions Llc
Purchase Details
Closed on
Mar 19, 2009
Sold by
Ellicott Maurice L and Case #07Cve11 15037
Bought by
Wells Fargo Bank Na
Purchase Details
Closed on
Nov 30, 2004
Sold by
Miller William R and Miller Kris Ann
Bought by
Ellicott Maurice L
Home Financials for this Owner
Home Financials are based on the most recent Mortgage that was taken out on this home.
Original Mortgage
$76,500
Interest Rate
8.3%
Mortgage Type
Purchase Money Mortgage
Purchase Details
Closed on
Oct 31, 1988
Bought by
Miller William R
Purchase Details
Closed on
Nov 1, 1983
Purchase Details
Closed on
Sep 1, 1983
Create a Home Valuation Report for This Property
The Home Valuation Report is an in-depth analysis detailing your home's value as well as a comparison with similar homes in the area
Home Values in the Area
Average Home Value in this Area
Purchase History
| Date | Buyer | Sale Price | Title Company |
|---|---|---|---|
| Wehinger Mark | $30,000 | Hostetler | |
| Dynamic Property Solutions Llc | $22,000 | Fidelity N | |
| Wells Fargo Bank Na | $47,745 | Fidelity N | |
| Ellicott Maurice L | $85,000 | -- | |
| Miller William R | $43,000 | -- | |
| -- | $38,000 | -- | |
| -- | $36,000 | -- |
Source: Public Records
Mortgage History
| Date | Status | Borrower | Loan Amount |
|---|---|---|---|
| Previous Owner | Ellicott Maurice L | $76,500 |
Source: Public Records
Tax History
| Year | Tax Paid | Tax Assessment Tax Assessment Total Assessment is a certain percentage of the fair market value that is determined by local assessors to be the total taxable value of land and additions on the property. | Land | Improvement |
|---|---|---|---|---|
| 2025 | $2,103 | $45,890 | $13,510 | $32,380 |
| 2024 | $2,103 | $45,890 | $13,510 | $32,380 |
| 2023 | $2,077 | $45,885 | $13,510 | $32,375 |
| 2022 | $1,812 | $22,720 | $7,810 | $14,910 |
| 2021 | $1,210 | $22,720 | $7,810 | $14,910 |
| 2020 | $1,211 | $22,720 | $7,810 | $14,910 |
| 2019 | $1,086 | $17,470 | $6,270 | $11,200 |
| 2018 | $1,051 | $17,470 | $6,270 | $11,200 |
| 2017 | $1,144 | $17,470 | $6,270 | $11,200 |
| 2016 | $1,150 | $17,360 | $4,760 | $12,600 |
| 2015 | $1,062 | $17,360 | $4,760 | $12,600 |
| 2014 | $1,046 | $17,360 | $4,760 | $12,600 |
| 2013 | $574 | $19,285 | $5,285 | $14,000 |
Source: Public Records
Map
Nearby Homes
- 3959 Carlton Ave
- 1640 Striebel Rd
- 1656 Vilardo Ln
- 1666-1668 Carstare Dr
- 1490 Elaine Rd Unit 1462
- 1792 Bostwick Rd
- 4111 Colby Ave
- 4024 Colby Ave
- 1370 Erickson Rd
- 1646 Clyde Place
- 1619 Basil Dr
- 1685 Alcoy Dr
- 1294 Dellwood Ave
- 1654 Wilton Dr
- 1620 Courtright Rd
- 1265 Elderwood Ave
- 1275 Elaine Rd
- 1269 Carolwood Ave
- 1251 Dellwood Ave
- 1623 Cunard Rd
- 3973 Carlton Ave
- 1609 Striebel Rd
- 3965 Carlton Ave
- 3995 Carlton Ave
- 1617 Striebel Rd
- 3986 Carlton Ave
- 1612 Striebel Rd
- 3980 Carlton Ave
- 1621 Striebel Rd
- 3994 Carlton Ave
- 4003 Carlton Ave
- 3972 Carlton Ave
- 1620 Striebel Rd
- 4000 Carlton Ave
- 3966 Carlton Ave
- 3951 Carlton Ave
- 1626 Striebel Rd
- 4006 Carlton Ave
- 1627 Striebel Rd
- 3958 Carlton Ave
Your Personal Tour Guide
Ask me questions while you tour the home.