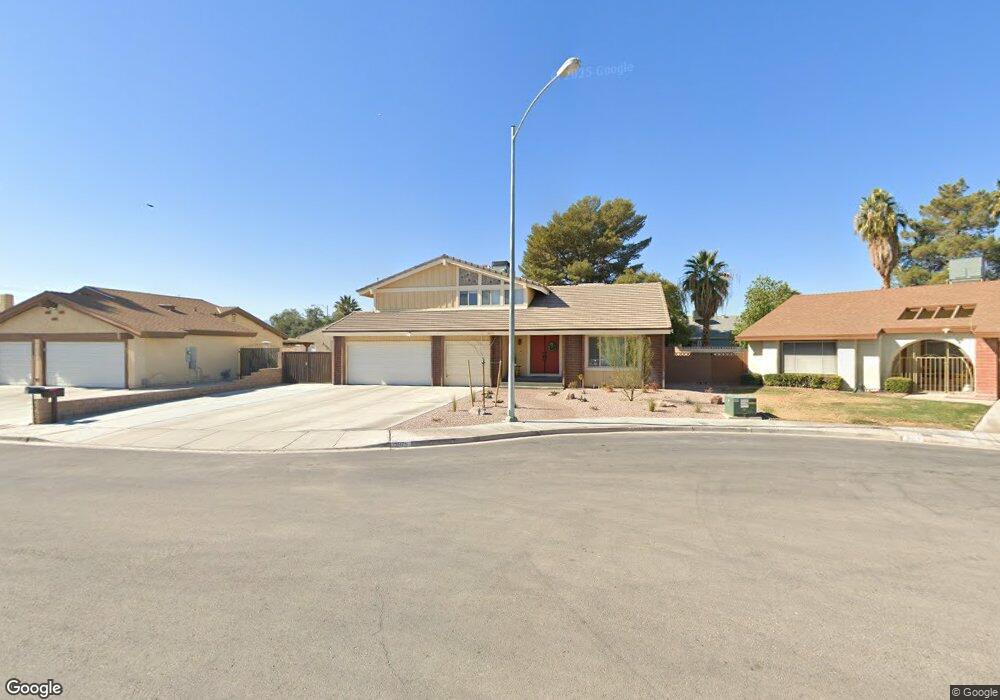
3979 Glory Ct Las Vegas, NV 89103
Estimated Value: $555,000 - $595,000
4
Beds
3
Baths
2,282
Sq Ft
$254/Sq Ft
Est. Value
About This Home
This home is located at 3979 Glory Ct, Las Vegas, NV 89103 and is currently estimated at $578,494, approximately $253 per square foot. 3979 Glory Ct is a home located in Clark County with nearby schools including C H Decker Elementary School, Kenny C Guinn Middle School, and Ed W Clark High School.
Ownership History
Date
Name
Owned For
Owner Type
Purchase Details
Closed on
Mar 19, 2007
Sold by
Robledo Leigh A and Robledo Rey D
Bought by
Robledo Leigh A and Robledo Rey D
Current Estimated Value
Purchase Details
Closed on
Mar 29, 2001
Sold by
Ono Terrance F
Bought by
Robledo Rey D and Robledo Leigh A
Home Financials for this Owner
Home Financials are based on the most recent Mortgage that was taken out on this home.
Original Mortgage
$164,700
Outstanding Balance
$60,896
Interest Rate
7.06%
Estimated Equity
$517,598
Purchase Details
Closed on
Mar 4, 1994
Sold by
Ono Terrence F and Ono Linda Sue
Bought by
Ono Terrence F and Ono Linda Sue
Create a Home Valuation Report for This Property
The Home Valuation Report is an in-depth analysis detailing your home's value as well as a comparison with similar homes in the area
Home Values in the Area
Average Home Value in this Area
Purchase History
| Date | Buyer | Sale Price | Title Company |
|---|---|---|---|
| Robledo Leigh A | -- | None Available | |
| Robledo Rey D | $183,000 | First American Title Co | |
| Ono Terrence F | -- | -- |
Source: Public Records
Mortgage History
| Date | Status | Borrower | Loan Amount |
|---|---|---|---|
| Open | Robledo Rey D | $164,700 |
Source: Public Records
Tax History Compared to Growth
Tax History
| Year | Tax Paid | Tax Assessment Tax Assessment Total Assessment is a certain percentage of the fair market value that is determined by local assessors to be the total taxable value of land and additions on the property. | Land | Improvement |
|---|---|---|---|---|
| 2025 | $1,883 | $106,066 | $52,500 | $53,566 |
| 2024 | $1,828 | $106,066 | $52,500 | $53,566 |
| 2023 | $1,828 | $94,542 | $42,000 | $52,542 |
| 2022 | $1,775 | $84,065 | $35,000 | $49,065 |
| 2021 | $1,723 | $74,435 | $26,950 | $47,485 |
| 2020 | $1,670 | $74,090 | $26,250 | $47,840 |
| 2019 | $1,622 | $72,370 | $24,500 | $47,870 |
| 2018 | $1,574 | $67,783 | $21,000 | $46,783 |
| 2017 | $1,959 | $66,800 | $18,550 | $48,250 |
| 2016 | $1,492 | $64,979 | $15,750 | $49,229 |
| 2015 | $1,488 | $61,435 | $12,250 | $49,185 |
| 2014 | $1,445 | $58,121 | $10,500 | $47,621 |
Source: Public Records
Map
Nearby Homes
- 5728 Lucky Pagoda Ct
- 3871 Sauceda Ln
- 4068 Spitze Dr
- 5873 Corazon Dr
- 5525 W Flamingo Rd Unit 1033
- 5525 W Flamingo Rd Unit 2030
- 5525 W Flamingo Rd Unit 2037
- 5944 Corazon Dr
- 4000 Camas Ct
- 5576 W Rochelle Ave Unit 27C
- 5576 W Rochelle Ave Unit 39A
- 5576 W Rochelle Ave Unit 9C
- 5576 W Rochelle Ave Unit 27A
- 5576 W Rochelle Ave Unit 13A
- 4150 Solteros St
- 4274 Rollingstone Dr
- 5881 Arandas Ct
- 3619 Edinburgh Dr
- 6250 W Flamingo Rd Unit 88
- 6250 W Flamingo Rd Unit 153
- 3991 Glory Ct
- 3967 Glory Ct
- 3980 Duneville St
- 3970 Duneville St
- 3990 Duneville St
- 3955 Glory Ct
- 3960 Duneville St
- 3978 Glory Ct
- 3990 Glory Ct
- 3966 Glory Ct
- 3944 Sauceda Ln
- 3945 Sauceda Ln
- 5738 Lucky Pagoda Ct
- 3979 Coolcrest Ct
- 3967 Coolcrest Ct
- 3934 Sauceda Ln
- 5758 Lucky Pagoda Ct
- 5748 Lucky Pagoda Ct
- 3991 Coolcrest Ct
- 3935 Sauceda Ln