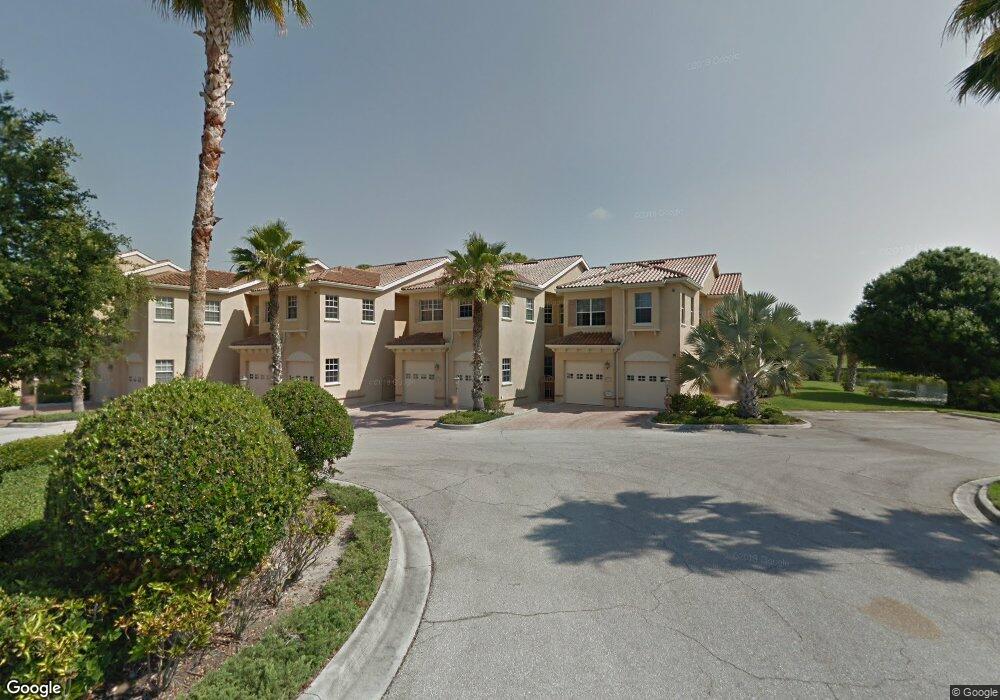
3979 Square East Ln Unit 11 Sarasota, FL 34238
Estimated Value: $387,593 - $472,000
3
Beds
3
Baths
2,196
Sq Ft
$191/Sq Ft
Est. Value
About This Home
This home is located at 3979 Square East Ln Unit 11, Sarasota, FL 34238 and is currently estimated at $418,898, approximately $190 per square foot. 3979 Square East Ln Unit 11 is a home located in Sarasota County with nearby schools including Gulf Gate Elementary School, Riverview High School, and Sarasota Middle School.
Ownership History
Date
Name
Owned For
Owner Type
Purchase Details
Closed on
Sep 15, 2020
Sold by
Prestancia 3979 Llc
Bought by
Hobbs David and Hobbs Kathryn
Current Estimated Value
Home Financials for this Owner
Home Financials are based on the most recent Mortgage that was taken out on this home.
Original Mortgage
$200,000
Outstanding Balance
$177,158
Interest Rate
2.8%
Mortgage Type
New Conventional
Estimated Equity
$241,740
Purchase Details
Closed on
Nov 9, 2017
Sold by
Blau Lori Ann
Bought by
Prestancia 3979 Llc
Purchase Details
Closed on
Aug 28, 2017
Sold by
Berman Jonathan
Bought by
Blau Lori Ann
Purchase Details
Closed on
Aug 25, 2004
Sold by
Palmer Square Development Co Llc
Bought by
Berman Jonathan
Home Financials for this Owner
Home Financials are based on the most recent Mortgage that was taken out on this home.
Original Mortgage
$287,920
Interest Rate
6.5%
Mortgage Type
Purchase Money Mortgage
Create a Home Valuation Report for This Property
The Home Valuation Report is an in-depth analysis detailing your home's value as well as a comparison with similar homes in the area
Home Values in the Area
Average Home Value in this Area
Purchase History
| Date | Buyer | Sale Price | Title Company |
|---|---|---|---|
| Hobbs David | $307,500 | King Clifford | |
| Prestancia 3979 Llc | -- | Attorney | |
| Blau Lori Ann | $300,000 | Attorney | |
| Berman Jonathan | $359,900 | -- |
Source: Public Records
Mortgage History
| Date | Status | Borrower | Loan Amount |
|---|---|---|---|
| Open | Hobbs David | $200,000 | |
| Previous Owner | Berman Jonathan | $287,920 |
Source: Public Records
Tax History Compared to Growth
Tax History
| Year | Tax Paid | Tax Assessment Tax Assessment Total Assessment is a certain percentage of the fair market value that is determined by local assessors to be the total taxable value of land and additions on the property. | Land | Improvement |
|---|---|---|---|---|
| 2024 | $4,697 | $301,100 | -- | $301,100 |
| 2023 | $4,697 | $365,800 | $0 | $365,800 |
| 2022 | $4,693 | $394,800 | $0 | $394,800 |
| 2021 | $3,779 | $256,800 | $0 | $256,800 |
| 2020 | $3,726 | $250,100 | $0 | $250,100 |
| 2019 | $3,377 | $224,000 | $0 | $224,000 |
| 2018 | $3,762 | $256,500 | $0 | $256,500 |
| 2017 | $2,287 | $171,147 | $0 | $0 |
| 2016 | $2,115 | $277,600 | $0 | $277,600 |
| 2015 | $2,149 | $242,200 | $0 | $242,200 |
| 2014 | $2,206 | $162,700 | $0 | $0 |
Source: Public Records
Map
Nearby Homes
- 3860 Boca Pointe Dr
- 4008 Crockers Lake Blvd Unit 11
- 3655 Square Ln W Unit 9
- 3991 Boca Pointe Dr
- 4009 Crockers Lake Blvd Unit 22
- 4001 Crockers Lake Blvd Unit 27
- 4017 Crockers Lake Blvd Unit 1421
- 4198 Boca Pointe Dr
- 3740 Pinecone Ct Unit 163
- 8221 Morgan Dr
- 4002 Crockers Lake Blvd Unit 1-128
- 2313 Flentwood Dr
- 2235 Flentwood Dr
- 3837 Torrey Pines Blvd
- 8025 Via Fiore
- 8301 Morgan Dr Unit 9
- 3876 Torrey Pines Blvd
- 7912 Pineglen Ct Unit 47
- 2329 York Dr
- 4037 Crockers Lake Blvd Unit 17
- 3955 Square Ln E
- 3955 Square Ln E Unit 3
- 3951 Square Ln E Unit 1
- 3951 Square Ln E
- 3969 Square East Ln Unit 7
- 3967 Square East Ln Unit 6
- 3965 Square East Ln Unit 5
- 3953 Square East Ln Unit 2
- 3951 Square East Ln Unit 1
- 3967 Square East Ln Unit 6
- 3971 Square East Ln Unit 8
- 3963 Square Ln E Unit 3963
- 3979 Square East Ln Unit 11
- 3963 Square Ln E Unit 4
- 3977 Square East Ln Unit 10
- 3975 Square Ln E Unit 9
- 3981 Square East Ln Unit 12
- 3981 Square East Ln Unit 12
- 3975 Square East Ln Unit 9
- 3977 Square East Ln Unit 10