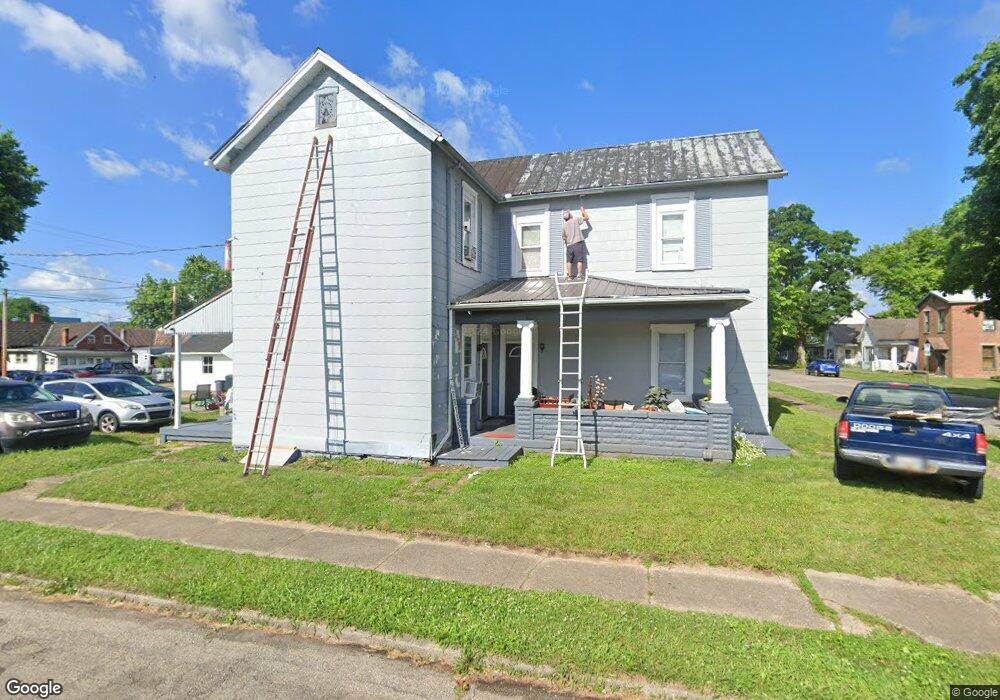
398 Clay St Chillicothe, OH 45601
Estimated Value: $78,000 - $145,000
4
Beds
2
Baths
1,886
Sq Ft
$67/Sq Ft
Est. Value
About This Home
This home is located at 398 Clay St, Chillicothe, OH 45601 and is currently estimated at $125,733, approximately $66 per square foot. 398 Clay St is a home located in Ross County with nearby schools including Chillicothe High School, Bishop Flaget School, and Wesley Taylor Preparatory School.
Ownership History
Date
Name
Owned For
Owner Type
Purchase Details
Closed on
Dec 3, 2009
Sold by
Delong James D
Bought by
Delong Kenneth J
Current Estimated Value
Home Financials for this Owner
Home Financials are based on the most recent Mortgage that was taken out on this home.
Original Mortgage
$61,200
Interest Rate
5.05%
Mortgage Type
Commercial
Purchase Details
Closed on
Nov 16, 2009
Sold by
Lilly Richard L and Lilly Sheila D
Bought by
Delong James D
Home Financials for this Owner
Home Financials are based on the most recent Mortgage that was taken out on this home.
Original Mortgage
$61,200
Interest Rate
5.05%
Mortgage Type
Commercial
Purchase Details
Closed on
Oct 13, 2009
Sold by
Lilly Richard L and Lilly Sheila D
Bought by
Delong James D
Home Financials for this Owner
Home Financials are based on the most recent Mortgage that was taken out on this home.
Original Mortgage
$61,200
Interest Rate
5.05%
Mortgage Type
Commercial
Create a Home Valuation Report for This Property
The Home Valuation Report is an in-depth analysis detailing your home's value as well as a comparison with similar homes in the area
Home Values in the Area
Average Home Value in this Area
Purchase History
| Date | Buyer | Sale Price | Title Company |
|---|---|---|---|
| Delong Kenneth J | $68,000 | Chicago Title | |
| Delong James D | $25,000 | Chicago Title | |
| Delong James D | $25,000 | Attorney |
Source: Public Records
Mortgage History
| Date | Status | Borrower | Loan Amount |
|---|---|---|---|
| Closed | Delong Kenneth J | $61,200 | |
| Previous Owner | Delong James D | $22,500 |
Source: Public Records
Tax History
| Year | Tax Paid | Tax Assessment Tax Assessment Total Assessment is a certain percentage of the fair market value that is determined by local assessors to be the total taxable value of land and additions on the property. | Land | Improvement |
|---|---|---|---|---|
| 2024 | $1,013 | $24,830 | $3,390 | $21,440 |
| 2023 | $1,013 | $24,830 | $3,390 | $21,440 |
| 2022 | $1,031 | $24,830 | $3,390 | $21,440 |
| 2021 | $984 | $20,780 | $3,020 | $17,760 |
| 2020 | $984 | $20,780 | $3,020 | $17,760 |
| 2019 | $985 | $20,780 | $3,020 | $17,760 |
| 2018 | $1,072 | $21,410 | $3,020 | $18,390 |
| 2017 | $1,154 | $21,410 | $3,020 | $18,390 |
| 2016 | $1,143 | $21,410 | $3,020 | $18,390 |
| 2015 | $1,073 | $19,600 | $3,020 | $16,580 |
| 2014 | $1,052 | $19,600 | $3,020 | $16,580 |
| 2013 | $1,053 | $19,600 | $3,020 | $16,580 |
Source: Public Records
Map
Nearby Homes
Your Personal Tour Guide
Ask me questions while you tour the home.