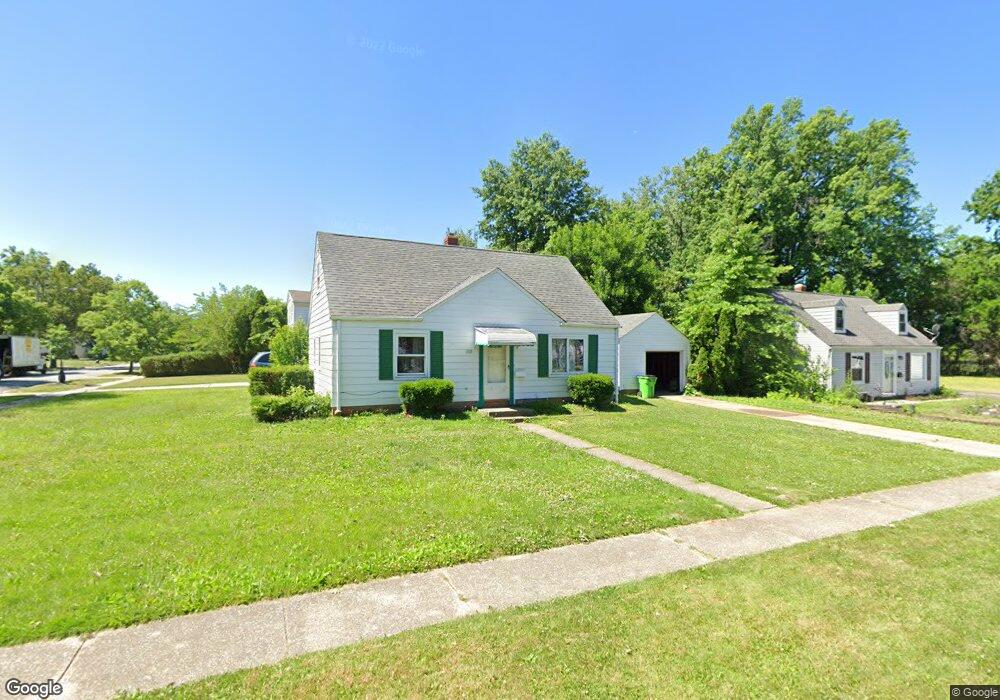
398 E 232nd St Euclid, OH 44123
Estimated Value: $120,110 - $128,000
4
Beds
1
Bath
1,220
Sq Ft
$101/Sq Ft
Est. Value
About This Home
This home is located at 398 E 232nd St, Euclid, OH 44123 and is currently estimated at $123,528, approximately $101 per square foot. 398 E 232nd St is a home located in Cuyahoga County with nearby schools including Bluestone Elementary School, Euclid High School, and Pinnacle Academy.
Ownership History
Date
Name
Owned For
Owner Type
Purchase Details
Closed on
Sep 9, 2016
Sold by
Trickett Steve and Trickett Victoria L
Bought by
Northshore Property Group Llc
Current Estimated Value
Home Financials for this Owner
Home Financials are based on the most recent Mortgage that was taken out on this home.
Original Mortgage
$78,500
Outstanding Balance
$62,803
Interest Rate
3.48%
Mortgage Type
Purchase Money Mortgage
Estimated Equity
$60,725
Purchase Details
Closed on
Sep 7, 2010
Sold by
Oliver Brian
Bought by
Trickett Steve
Purchase Details
Closed on
Dec 11, 2009
Sold by
Estate Of Helen J Bredesen
Bought by
Oliver Brian and Bredsen Family Trust
Purchase Details
Closed on
Aug 2, 1983
Sold by
Hoch Milton O and Hoch Arietta
Bought by
Bredesen Helen J
Purchase Details
Closed on
Jan 1, 1975
Bought by
Hoch Milton O and Hoch Arietta
Create a Home Valuation Report for This Property
The Home Valuation Report is an in-depth analysis detailing your home's value as well as a comparison with similar homes in the area
Home Values in the Area
Average Home Value in this Area
Purchase History
| Date | Buyer | Sale Price | Title Company |
|---|---|---|---|
| Northshore Property Group Llc | -- | All Real Estate Solutions | |
| Trickett Steve | $40,000 | First American Title Ins Co | |
| Oliver Brian | -- | None Available | |
| Bredesen Helen J | $45,000 | -- | |
| Hoch Milton O | -- | -- |
Source: Public Records
Mortgage History
| Date | Status | Borrower | Loan Amount |
|---|---|---|---|
| Open | Northshore Property Group Llc | $78,500 |
Source: Public Records
Tax History
| Year | Tax Paid | Tax Assessment Tax Assessment Total Assessment is a certain percentage of the fair market value that is determined by local assessors to be the total taxable value of land and additions on the property. | Land | Improvement |
|---|---|---|---|---|
| 2024 | $2,461 | $34,755 | $9,380 | $25,375 |
| 2023 | $1,761 | $19,360 | $6,790 | $12,570 |
| 2022 | $1,875 | $19,360 | $6,790 | $12,570 |
| 2021 | $1,917 | $19,360 | $6,790 | $12,570 |
| 2020 | $1,944 | $17,920 | $6,300 | $11,620 |
| 2019 | $1,824 | $51,200 | $18,000 | $33,200 |
| 2018 | $1,762 | $17,920 | $6,300 | $11,620 |
| 2017 | $1,925 | $14,010 | $6,200 | $7,810 |
| 2016 | $1,666 | $14,010 | $6,200 | $7,810 |
| 2015 | $1,539 | $14,010 | $6,200 | $7,810 |
| 2014 | $1,523 | $14,010 | $6,200 | $7,810 |
Source: Public Records
Map
Nearby Homes
- 23198 Gay St
- 521 Kenwood Dr Unit B-5
- 461 Kenwood Dr Unit T3
- 470 Kenwood Dr Unit D
- 490 Kenwood Dr Unit B
- 450 Kenwood Dr Unit D-12
- 450 Kenwood Dr Unit E12
- 22751 Fox Ave
- 324 E 235th St
- 421 Kenwood Dr Unit G
- 334 E 238th St
- 323 E 235th St
- 24181 Devoe Ave
- 422 Clearview Dr Unit J10
- 303 E 235th St
- 170 E 220th St
- 22301 Milton Dr
- 226 E 216th St
- 244 E 238th St
- 104 E 219th St
Your Personal Tour Guide
Ask me questions while you tour the home.