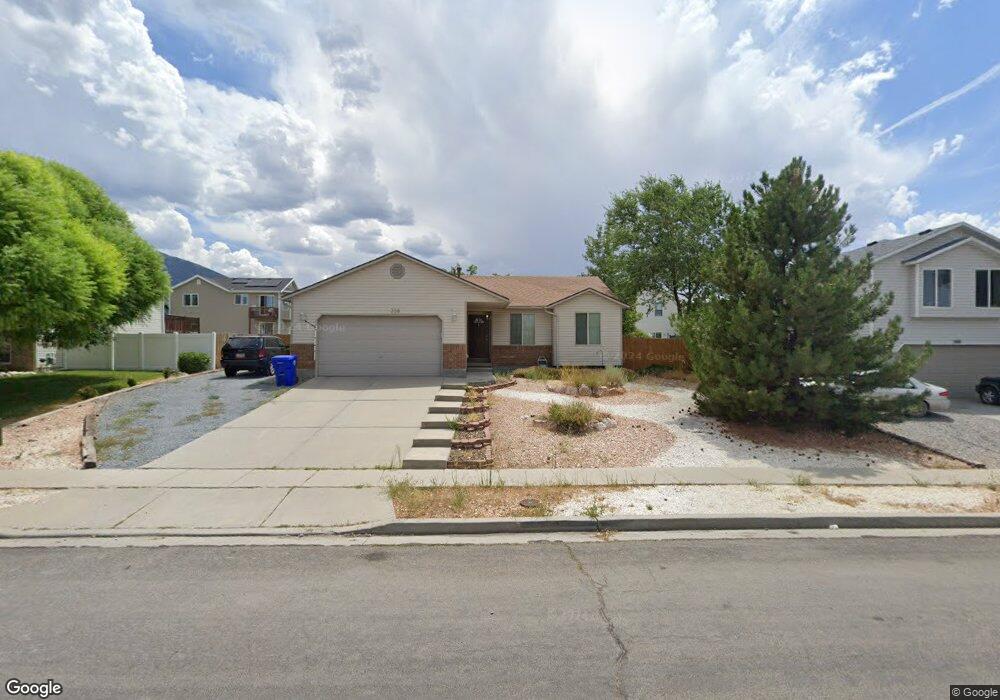
398 E 740 N Tooele, UT 84074
Estimated Value: $425,000 - $449,740
5
Beds
3
Baths
2,350
Sq Ft
$186/Sq Ft
Est. Value
About This Home
This home is located at 398 E 740 N, Tooele, UT 84074 and is currently estimated at $436,435, approximately $185 per square foot. 398 E 740 N is a home located in Tooele County with nearby schools including Sterling Elementary School, Tooele Junior High School, and Tooele High School.
Ownership History
Date
Name
Owned For
Owner Type
Purchase Details
Closed on
Jun 28, 2018
Sold by
Woodhouse Adrian H and Woodhouse Nikki J
Bought by
Delaney Roger Andre and Delaney Chelsey
Current Estimated Value
Home Financials for this Owner
Home Financials are based on the most recent Mortgage that was taken out on this home.
Original Mortgage
$245,160
Outstanding Balance
$212,938
Interest Rate
4.6%
Mortgage Type
VA
Estimated Equity
$223,498
Purchase Details
Closed on
Jan 11, 2010
Sold by
Magers Zane J and Magers Tara S
Bought by
Woodhouse Adrian H and Woodhouse Nikki J
Home Financials for this Owner
Home Financials are based on the most recent Mortgage that was taken out on this home.
Original Mortgage
$172,500
Interest Rate
4.77%
Mortgage Type
New Conventional
Create a Home Valuation Report for This Property
The Home Valuation Report is an in-depth analysis detailing your home's value as well as a comparison with similar homes in the area
Home Values in the Area
Average Home Value in this Area
Purchase History
| Date | Buyer | Sale Price | Title Company |
|---|---|---|---|
| Delaney Roger Andre | -- | Security Title Insurance Age | |
| Woodhouse Adrian H | -- | Surety Title |
Source: Public Records
Mortgage History
| Date | Status | Borrower | Loan Amount |
|---|---|---|---|
| Open | Delaney Roger Andre | $245,160 | |
| Previous Owner | Woodhouse Adrian H | $172,500 |
Source: Public Records
Tax History Compared to Growth
Tax History
| Year | Tax Paid | Tax Assessment Tax Assessment Total Assessment is a certain percentage of the fair market value that is determined by local assessors to be the total taxable value of land and additions on the property. | Land | Improvement |
|---|---|---|---|---|
| 2025 | $2,666 | $222,333 | $56,375 | $165,958 |
| 2024 | $2,917 | $222,635 | $56,375 | $166,260 |
| 2023 | $2,917 | $234,389 | $53,689 | $180,700 |
| 2022 | $2,558 | $220,040 | $53,453 | $166,587 |
| 2021 | $2,078 | $149,525 | $21,381 | $128,144 |
| 2020 | $1,978 | $246,901 | $38,875 | $208,026 |
| 2019 | $1,930 | $236,995 | $38,875 | $198,120 |
| 2018 | $1,786 | $207,898 | $40,000 | $167,898 |
| 2017 | $1,330 | $183,807 | $32,500 | $151,307 |
| 2016 | $1,099 | $90,239 | $17,875 | $72,364 |
| 2015 | $1,099 | $79,949 | $0 | $0 |
| 2014 | -- | $79,949 | $0 | $0 |
Source: Public Records
Map
Nearby Homes
- 367 E 740 N
- 516 N Broadway Ave
- 336 E 700 N
- 779 N 560 E
- 261 E 670 N Unit 220
- 252 E 715 N Unit 216
- 535 E 670 N
- 635 Chimesview Cir
- 603 Valley View Dr
- 298 E 600 N
- 698 Brook Ave E
- 294 E 600 N
- 180 1000 N
- 151 E 730 N
- 875 N 650 E
- 590 N Brook Ave
- 455 Lindy Way
- 122 E 730 N Unit 105
- 118 E 730 N Unit 104
- 588 E 1030 N