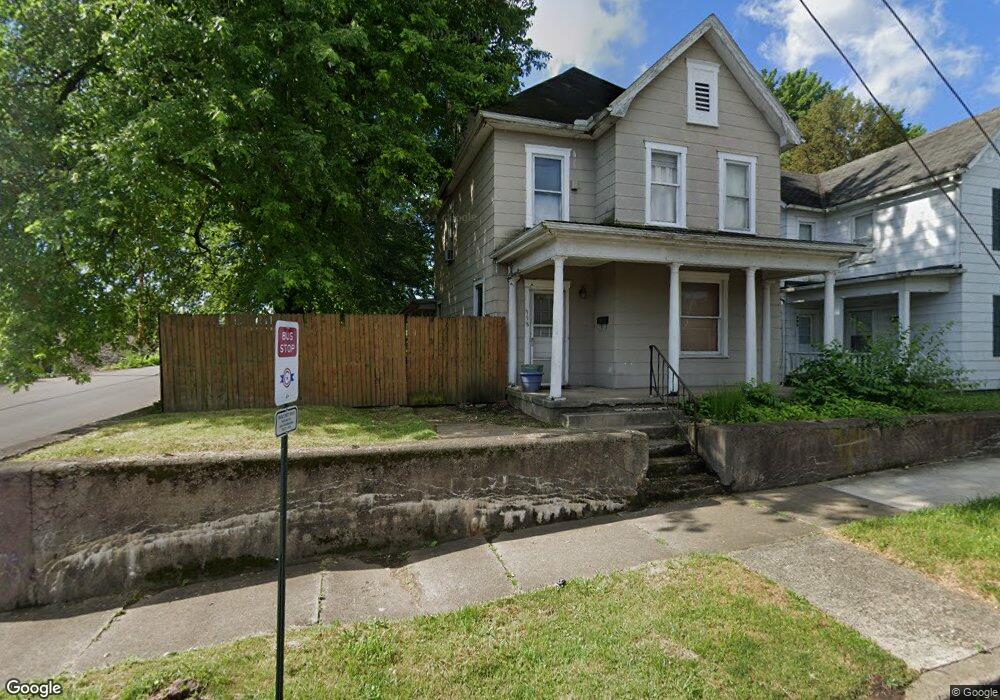
398 E 7th St Chillicothe, OH 45601
Estimated Value: $96,000 - $112,633
3
Beds
2
Baths
1,880
Sq Ft
$56/Sq Ft
Est. Value
About This Home
This home is located at 398 E 7th St, Chillicothe, OH 45601 and is currently estimated at $105,158, approximately $55 per square foot. 398 E 7th St is a home located in Ross County with nearby schools including Chillicothe High School, Bishop Flaget School, and Wesley Taylor Preparatory School.
Ownership History
Date
Name
Owned For
Owner Type
Purchase Details
Closed on
Oct 9, 2024
Sold by
Olney Casey J and Demint Miranda L
Bought by
Tackett Ashley Faye-Nicole
Current Estimated Value
Home Financials for this Owner
Home Financials are based on the most recent Mortgage that was taken out on this home.
Original Mortgage
$79,800
Outstanding Balance
$78,961
Interest Rate
6.35%
Mortgage Type
New Conventional
Estimated Equity
$26,197
Purchase Details
Closed on
Apr 11, 2008
Sold by
Hurles Shirley A and Hurles Tony R
Bought by
Olney Casey J and Demint Miranda L
Home Financials for this Owner
Home Financials are based on the most recent Mortgage that was taken out on this home.
Original Mortgage
$53,067
Interest Rate
6.32%
Mortgage Type
FHA
Create a Home Valuation Report for This Property
The Home Valuation Report is an in-depth analysis detailing your home's value as well as a comparison with similar homes in the area
Home Values in the Area
Average Home Value in this Area
Purchase History
| Date | Buyer | Sale Price | Title Company |
|---|---|---|---|
| Tackett Ashley Faye-Nicole | $85,000 | None Listed On Document | |
| Tackett Ashley Faye-Nicole | $85,000 | None Listed On Document | |
| Olney Casey J | $53,900 | Title First |
Source: Public Records
Mortgage History
| Date | Status | Borrower | Loan Amount |
|---|---|---|---|
| Open | Tackett Ashley Faye-Nicole | $79,800 | |
| Closed | Tackett Ashley Faye-Nicole | $79,800 | |
| Previous Owner | Olney Casey J | $53,067 |
Source: Public Records
Tax History
| Year | Tax Paid | Tax Assessment Tax Assessment Total Assessment is a certain percentage of the fair market value that is determined by local assessors to be the total taxable value of land and additions on the property. | Land | Improvement |
|---|---|---|---|---|
| 2024 | $689 | $17,280 | $3,550 | $13,730 |
| 2023 | $689 | $17,280 | $3,550 | $13,730 |
| 2022 | $702 | $17,280 | $3,550 | $13,730 |
| 2021 | $756 | $16,310 | $3,140 | $13,170 |
| 2020 | $755 | $16,310 | $3,140 | $13,170 |
| 2019 | $756 | $16,310 | $3,140 | $13,170 |
| 2018 | $819 | $16,730 | $3,140 | $13,590 |
| 2017 | $881 | $16,730 | $3,140 | $13,590 |
| 2016 | $873 | $16,730 | $3,140 | $13,590 |
| 2015 | $822 | $15,400 | $3,140 | $12,260 |
| 2014 | $804 | $15,400 | $3,140 | $12,260 |
| 2013 | $805 | $15,400 | $3,140 | $12,260 |
Source: Public Records
Map
Nearby Homes
Your Personal Tour Guide
Ask me questions while you tour the home.