398 Hillcrest Rd Needham, MA 02492
Estimated Value: $1,338,000 - $1,493,000
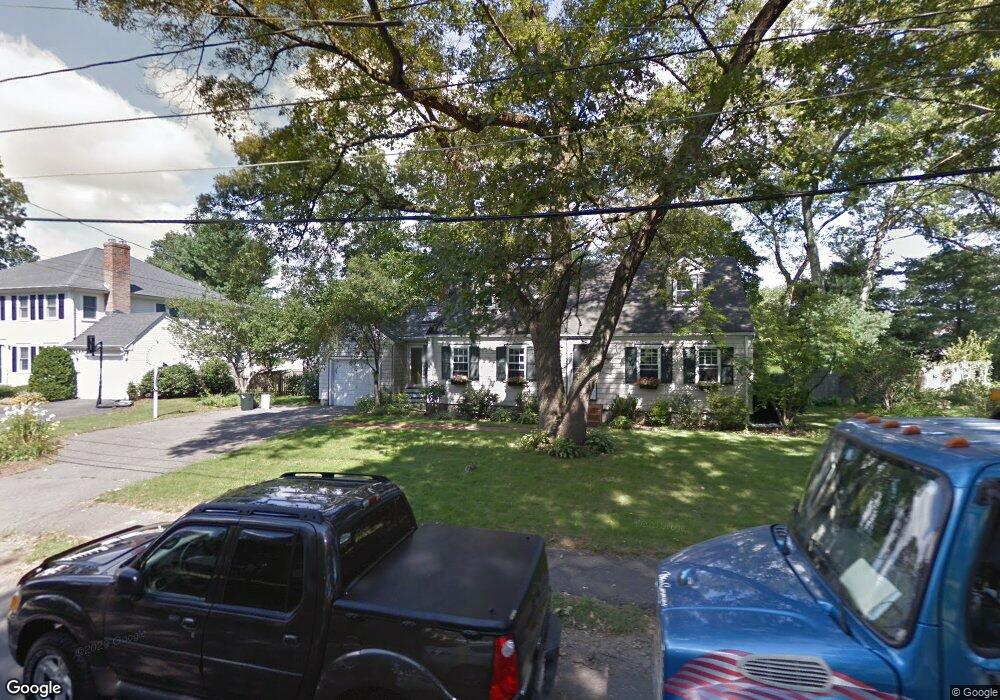
About This Home
This home is located at 398 Hillcrest Rd, Needham, MA 02492 and is currently estimated at $1,412,107, approximately $1,047 per square foot. 398 Hillcrest Rd is a home located in Norfolk County with nearby schools including Mitchell Elementary School, High Rock Middle School, and Pollard Middle School.
Ownership History
We collect this data history from publicly available records. To have your information removed, we recommend requesting removal directly through your county’s website.
Purchase Details
Purchase Details
Home Values in the Area
Average Home Value in this Area
Purchase History
We collect this data history from publicly available records. To have your information removed, we recommend requesting removal directly through your county’s website.
| Date | Buyer | Sale Price | Title Company |
|---|---|---|---|
| -- | -- | ||
| -- | -- | ||
| $56,900 | -- |
Mortgage History
We collect this data history from publicly available records. To have your information removed, we recommend requesting removal directly through your county’s website.
| Date | Status | Borrower | Loan Amount |
|---|---|---|---|
| Previous Owner | $237,500 | ||
| Previous Owner | $50,000 | ||
| Previous Owner | $125,000 |
Tax History
We collect this data history from publicly available records. To have your information removed, we recommend requesting removal directly through your county’s website.
| Year | Tax Paid | Tax Assessment Tax Assessment Total Assessment is a certain percentage of the fair market value that is determined by local assessors to be the total taxable value of land and additions on the property. | Land | Improvement |
|---|---|---|---|---|
| 2025 | $10,744 | $1,013,600 | $802,300 | $211,300 |
| 2024 | $10,039 | $801,800 | $590,500 | $211,300 |
| 2023 | $10,217 | $783,500 | $590,500 | $193,000 |
| 2022 | $9,490 | $709,800 | $522,700 | $187,100 |
| 2021 | $9,249 | $709,800 | $522,700 | $187,100 |
| 2020 | $8,914 | $713,700 | $522,700 | $191,000 |
| 2019 | $8,234 | $664,600 | $475,300 | $189,300 |
| 2018 | $7,895 | $664,600 | $475,300 | $189,300 |
| 2017 | $7,613 | $640,300 | $475,300 | $165,000 |
| 2016 | $7,859 | $681,000 | $475,300 | $205,700 |
| 2015 | $7,688 | $681,000 | $475,300 | $205,700 |
| 2014 | $6,960 | $597,900 | $396,300 | $201,600 |
Map
- 390 Hillcrest Rd
- 76 Brookline St
- 384 Hillcrest Rd
- 84 Brookline St
- 393 Hillcrest Rd
- 381 Hillcrest Rd
- 406 Hillcrest Rd
- 90 Brookline St
- 62 Brookline St
- 376 Hillcrest Rd
- 403 Hillcrest Rd
- 75 Brookline St
- 375 Hillcrest Rd
- 21 Colby St
- 56 Brookline St
- 1 Colgate Rd
- 69 Brookline St
- 412 Hillcrest Rd
- 96 Brookline St
- 130 Woodledge Rd
Ask me questions while you tour the home.