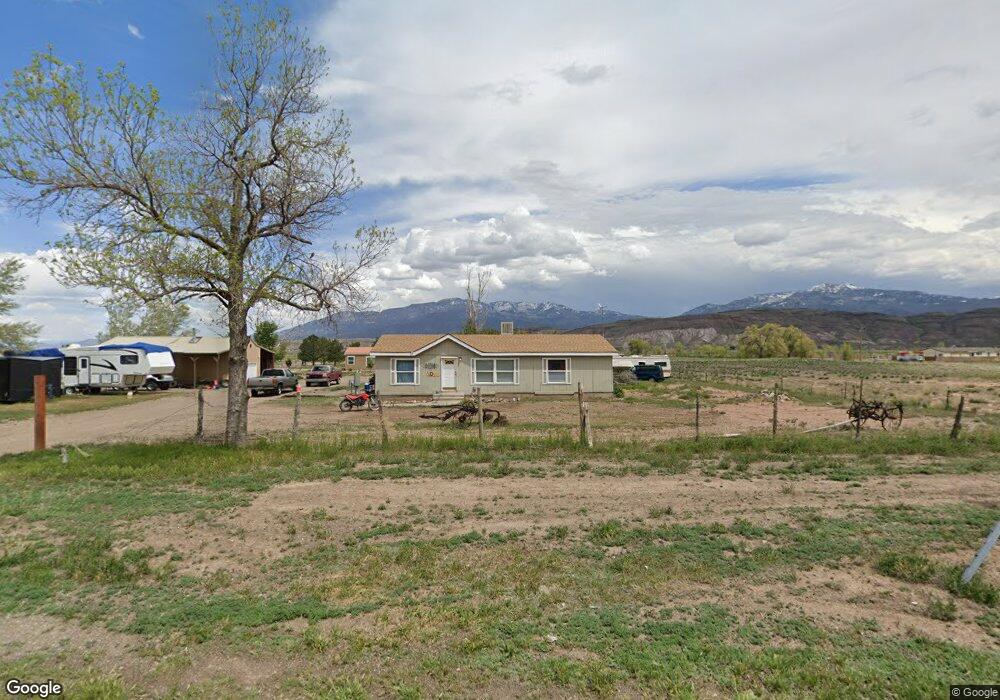
398 N 100 E Joseph, UT 84739
Estimated Value: $247,000 - $319,000
Studio
--
Bath
1,280
Sq Ft
$222/Sq Ft
Est. Value
About This Home
This home is located at 398 N 100 E, Joseph, UT 84739 and is currently estimated at $284,771, approximately $222 per square foot. 398 N 100 E is a home located in Sevier County with nearby schools including Monroe School, South Sevier Middle School, and South Sevier High School.
Ownership History
Date
Name
Owned For
Owner Type
Purchase Details
Closed on
Mar 4, 2022
Sold by
Alexander Steven W and Alexander Brent W
Bought by
Alexander Steven and Alexander Sierra
Current Estimated Value
Home Financials for this Owner
Home Financials are based on the most recent Mortgage that was taken out on this home.
Original Mortgage
$280,000
Outstanding Balance
$259,689
Interest Rate
3.76%
Estimated Equity
$25,082
Purchase Details
Closed on
Jun 25, 2019
Sold by
Bagley Julie Lynn
Bought by
Obray Tiffany and Obray Brent W
Home Financials for this Owner
Home Financials are based on the most recent Mortgage that was taken out on this home.
Original Mortgage
$147,283
Interest Rate
4%
Purchase Details
Closed on
Sep 22, 2015
Sold by
Simmons Martin W and Busico Mark
Bought by
Simmons Roger and Simmons Deborah A
Home Financials for this Owner
Home Financials are based on the most recent Mortgage that was taken out on this home.
Original Mortgage
$78,400
Interest Rate
3.9%
Create a Home Valuation Report for This Property
The Home Valuation Report is an in-depth analysis detailing your home's value as well as a comparison with similar homes in the area
Purchase History
| Date | Buyer | Sale Price | Title Company |
|---|---|---|---|
| Alexander Steven | -- | First American Title | |
| Obray Tiffany | -- | First American Title | |
| Simmons Roger | -- | Meridian Title Company |
Source: Public Records
Mortgage History
| Date | Status | Borrower | Loan Amount |
|---|---|---|---|
| Open | Alexander Steven | $280,000 | |
| Previous Owner | Obray Tiffany | $147,283 | |
| Previous Owner | Simmons Roger | $78,400 |
Source: Public Records
Tax History
| Year | Tax Paid | Tax Assessment Tax Assessment Total Assessment is a certain percentage of the fair market value that is determined by local assessors to be the total taxable value of land and additions on the property. | Land | Improvement |
|---|---|---|---|---|
| 2025 | $1,770 | $204,085 | $41,500 | $162,585 |
| 2024 | $1,770 | $209,005 | $38,500 | $170,505 |
| 2023 | $1,843 | $197,775 | $27,150 | $170,625 |
| 2022 | $1,948 | $192,185 | $27,111 | $165,074 |
| 2021 | $1,642 | $133,798 | $29,288 | $104,510 |
| 2020 | $1,588 | $122,284 | $27,956 | $94,328 |
| 2019 | $1,475 | $120,940 | $26,620 | $94,320 |
| 2018 | $1,441 | $111,780 | $26,620 | $85,160 |
| 2017 | $1,286 | $95,540 | $26,620 | $68,920 |
| 2016 | $544 | $95,540 | $0 | $0 |
| 2015 | $544 | $52,550 | $0 | $0 |
| 2014 | $544 | $52,550 | $0 | $0 |
Source: Public Records
Map
Nearby Homes
- 89 Sevier Hwy
- 225 N 100 E
- 1085 S River Ridge Ln
- 100 S 100 E
- 260 N Sevier Hwy
- 1952 Utah 118
- 871 N Brooklyn Rd
- Tbd West County Rd 1875 Unit LotWP001
- 1103 N Brooklyn Rd
- 1025 S 800 E
- 0 Approx 2115 Brooklyn Rd
- Tbd Highway 89
- Tbd Highway 89
- Tbd Highway 89
- Tbd Highway 89
- Tbd Highway 89
- Tbd Highway 89
- Tbd Highway 89
- 251 N 580 W
- 81 N 500 W
Your Personal Tour Guide
Ask me questions while you tour the home.