D
Landlord's Agent in 2025
Dustin Zadel
Golden Gate Real Estate
(614) 625-2140
5 Total Sales
Estimated Value: $198,000 - $333,615
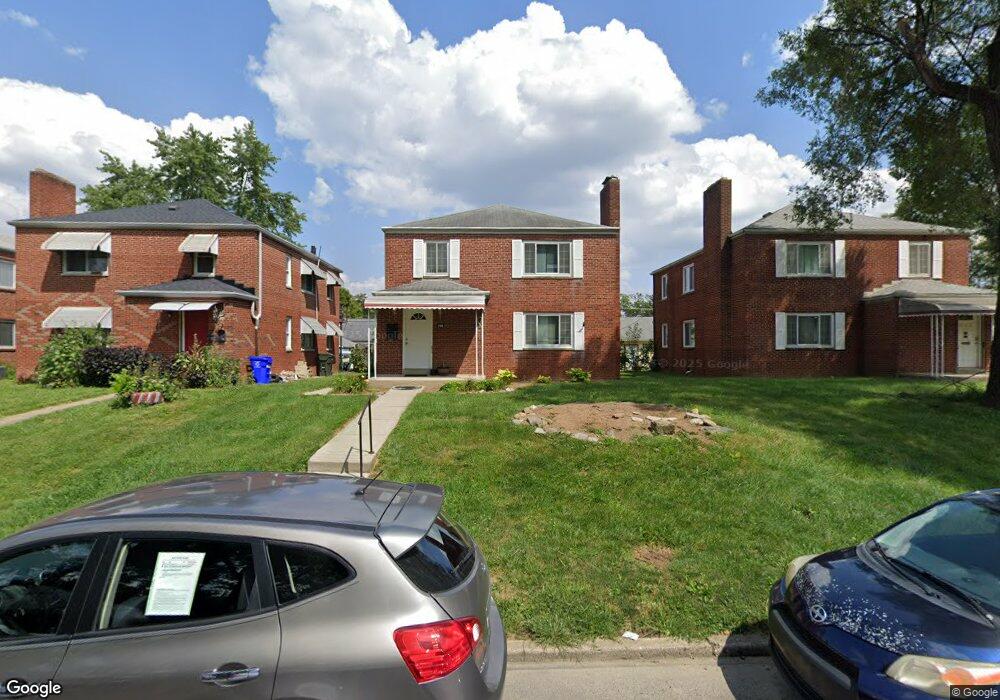
EMAIL ONLY FOR INQUIRIES. Section 8 accepted. Located in the community of Westgate! This brick duplex has been recently updated and renovated. This 2 bed, 1 full bath is located on the 1st floor. Lawn care included. Fenced in back yard with own reserved parking spot. Kitchen comes with all appliances. Decorative fireplace in living room. Full bath has been updated with new vanity, high and low flow toilet as well as subway tile and large rain shower head. Qualifications: No pets, must be able to move within 30 days. No evictions, or active landlord collections, or utility collections. Income must equal at least 3x monthly rent. Job time of at least 2 years or similar field of 2 years. No felonies.
Last Agent to Rent the Property
Golden Gate Real Estate License #2010001163 Listed on: 07/01/2025
| Date | Buyer | Sale Price | Title Company |
|---|---|---|---|
| Kirk Scot E | $103,900 | None Available | |
| Lamothe Joseph A | $54,000 | -- | |
| -- | -- | -- |
| Date | Status | Borrower | Loan Amount |
|---|---|---|---|
| Open | Kirk Scot E | $126,357 |
| Date | Event | Price | List to Sale | Price per Sq Ft |
|---|---|---|---|---|
| 07/01/2025 07/01/25 | Rented | $1,000 | 0.0% | -- |
| 07/01/2025 07/01/25 | For Rent | $1,000 | +16.3% | -- |
| 07/21/2022 07/21/22 | Rented | $860 | 0.0% | -- |
| 04/11/2022 04/11/22 | Price Changed | $860 | -4.4% | $0 / Sq Ft |
| 04/02/2022 04/02/22 | For Rent | $900 | -- | -- |
| Year | Tax Paid | Tax Assessment Tax Assessment Total Assessment is a certain percentage of the fair market value that is determined by local assessors to be the total taxable value of land and additions on the property. | Land | Improvement |
|---|---|---|---|---|
| 2024 | $4,072 | $89,780 | $22,820 | $66,960 |
| 2023 | $4,020 | $89,775 | $22,820 | $66,955 |
| 2022 | $2,554 | $48,650 | $11,760 | $36,890 |
| 2021 | $2,559 | $48,650 | $11,760 | $36,890 |
| 2020 | $2,562 | $48,650 | $11,760 | $36,890 |
| 2019 | $2,492 | $40,570 | $9,800 | $30,770 |
| 2018 | $1,259 | $40,570 | $9,800 | $30,770 |
| 2017 | $1,298 | $40,570 | $9,800 | $30,770 |
| 2016 | $1,460 | $21,490 | $6,370 | $15,120 |
| 2015 | $665 | $21,490 | $6,370 | $15,120 |
| 2014 | $1,332 | $21,490 | $6,370 | $15,120 |
| 2013 | $730 | $23,870 | $7,070 | $16,800 |
D
Landlord's Agent in 2025
Dustin Zadel
Golden Gate Real Estate
(614) 625-2140
5 Total Sales
Source: Columbus and Central Ohio Regional MLS
MLS Number: 225024026
APN: 010-064169
Disclaimer: Certain information contained herein is derived from information provided by parties other than Homes.com. All information provided is deemed reliable, but is not guaranteed to be accurate and should be independently verified.
![]() IDX information is provided exclusively for personal, non-commercial use, and may not be used for any purpose other than to identify prospective properties consumers may be interested in purchasing.
IDX information is provided exclusively for personal, non-commercial use, and may not be used for any purpose other than to identify prospective properties consumers may be interested in purchasing.
Information is deemed reliable but not guaranteed.
