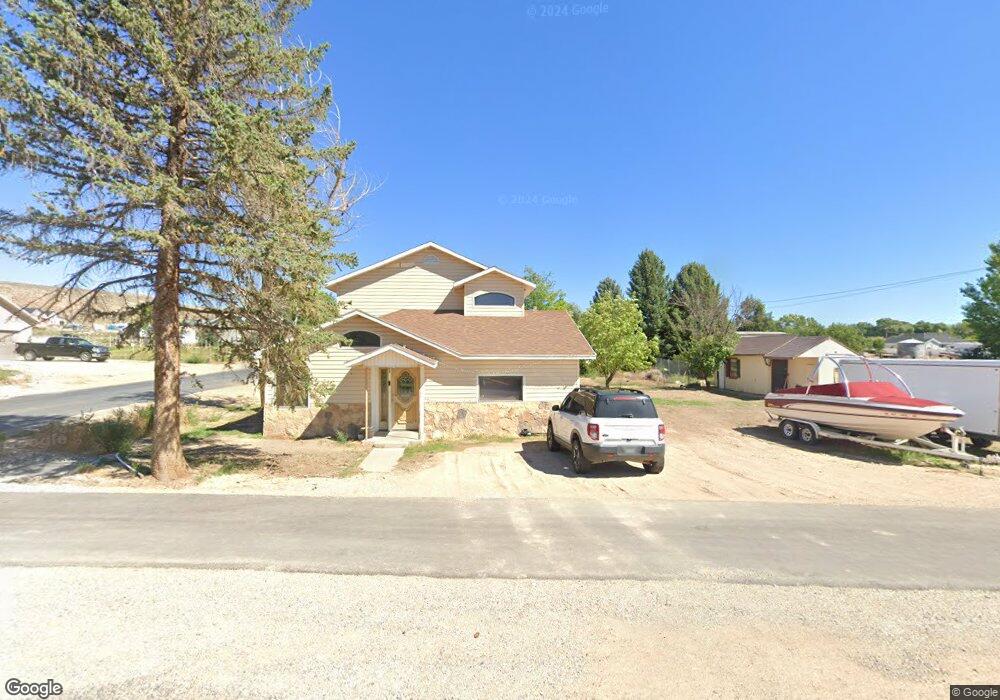
398 W 100 S Gunnison, UT 84634
Gunnison NeighborhoodEstimated Value: $280,000 - $319,000
3
Beds
2
Baths
1,990
Sq Ft
$148/Sq Ft
Est. Value
About This Home
This home is located at 398 W 100 S, Gunnison, UT 84634 and is currently estimated at $293,853, approximately $147 per square foot. 398 W 100 S is a home located in Sanpete County.
Ownership History
Date
Name
Owned For
Owner Type
Purchase Details
Closed on
Aug 7, 2025
Sold by
Ashton Taylor J
Bought by
Villalta Shannon and Villalta Roman M
Current Estimated Value
Home Financials for this Owner
Home Financials are based on the most recent Mortgage that was taken out on this home.
Original Mortgage
$275,910
Outstanding Balance
$275,435
Interest Rate
6.77%
Mortgage Type
Construction
Estimated Equity
$18,418
Purchase Details
Closed on
Jun 30, 2011
Sold by
Springleaf Financial Services Inc
Bought by
Sorensen Omner
Create a Home Valuation Report for This Property
The Home Valuation Report is an in-depth analysis detailing your home's value as well as a comparison with similar homes in the area
Home Values in the Area
Average Home Value in this Area
Purchase History
| Date | Buyer | Sale Price | Title Company |
|---|---|---|---|
| Villalta Shannon | $278,669 | Professional Title Servs Inc | |
| Sorensen Omner | -- | -- |
Source: Public Records
Mortgage History
| Date | Status | Borrower | Loan Amount |
|---|---|---|---|
| Open | Villalta Shannon | $275,910 | |
| Closed | Villalta Shannon | $15,500 |
Source: Public Records
Tax History Compared to Growth
Tax History
| Year | Tax Paid | Tax Assessment Tax Assessment Total Assessment is a certain percentage of the fair market value that is determined by local assessors to be the total taxable value of land and additions on the property. | Land | Improvement |
|---|---|---|---|---|
| 2024 | $1,396 | $126,448 | $0 | $0 |
| 2023 | $1,438 | $121,569 | $0 | $0 |
| 2022 | $1,390 | $108,544 | $0 | $0 |
| 2021 | $1,313 | $88,677 | $0 | $0 |
| 2020 | $1,226 | $77,672 | $0 | $0 |
| 2019 | $1,168 | $72,177 | $0 | $0 |
| 2018 | $1,112 | $118,700 | $18,150 | $100,550 |
| 2017 | $1,055 | $65,286 | $0 | $0 |
| 2016 | $998 | $61,744 | $0 | $0 |
| 2015 | $999 | $61,744 | $0 | $0 |
| 2014 | $983 | $61,744 | $0 | $0 |
| 2013 | $981 | $61,758 | $0 | $0 |
Source: Public Records
Map
Nearby Homes