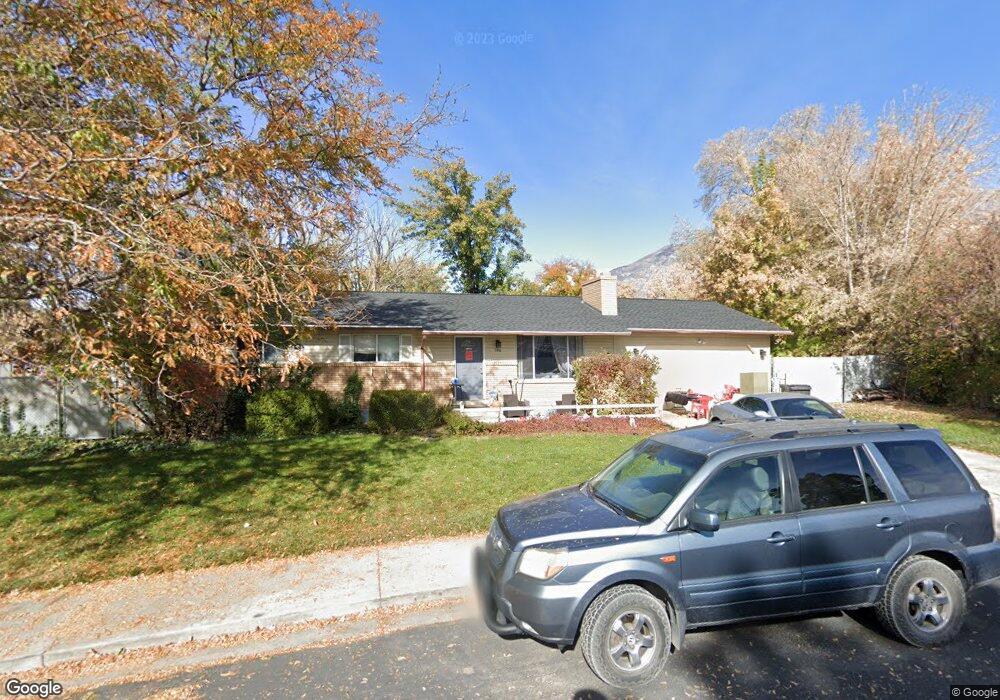
398 W 700 N Lindon, UT 84042
Estimated Value: $580,000 - $748,000
5
Beds
3
Baths
2,376
Sq Ft
$278/Sq Ft
Est. Value
About This Home
This home is located at 398 W 700 N, Lindon, UT 84042 and is currently estimated at $661,180, approximately $278 per square foot. 398 W 700 N is a home located in Utah County with nearby schools including Lindon Elementary School, Oak Canyon Junior High School, and Pleasant Grove High School.
Ownership History
Date
Name
Owned For
Owner Type
Purchase Details
Closed on
Sep 7, 2005
Sold by
Tew Kathryn Durrant
Bought by
Brady Joseph and Brady Jackie
Current Estimated Value
Home Financials for this Owner
Home Financials are based on the most recent Mortgage that was taken out on this home.
Original Mortgage
$157,520
Outstanding Balance
$83,796
Interest Rate
5.76%
Mortgage Type
Fannie Mae Freddie Mac
Estimated Equity
$577,384
Purchase Details
Closed on
Jun 28, 2004
Sold by
Tew Kathryn K D
Bought by
Tew Kathryn Durrant
Purchase Details
Closed on
Apr 28, 2003
Sold by
Tew Paul C and Tew Kathryn K D
Bought by
Tew Kathryn Durrant
Purchase Details
Closed on
Aug 10, 2001
Sold by
Tew Paul Christopher
Bought by
Tew Kathryn Durrant
Home Financials for this Owner
Home Financials are based on the most recent Mortgage that was taken out on this home.
Original Mortgage
$40,000
Interest Rate
6.99%
Mortgage Type
Seller Take Back
Create a Home Valuation Report for This Property
The Home Valuation Report is an in-depth analysis detailing your home's value as well as a comparison with similar homes in the area
Home Values in the Area
Average Home Value in this Area
Purchase History
| Date | Buyer | Sale Price | Title Company |
|---|---|---|---|
| Brady Joseph | -- | First American Title Agency | |
| Tew Kathryn Durrant | -- | -- | |
| Tew Kathryn Durrant | -- | -- | |
| Tew Kathryn Durrant | -- | -- |
Source: Public Records
Mortgage History
| Date | Status | Borrower | Loan Amount |
|---|---|---|---|
| Open | Brady Joseph | $157,520 | |
| Previous Owner | Tew Kathryn Durrant | $40,000 |
Source: Public Records
Tax History Compared to Growth
Tax History
| Year | Tax Paid | Tax Assessment Tax Assessment Total Assessment is a certain percentage of the fair market value that is determined by local assessors to be the total taxable value of land and additions on the property. | Land | Improvement |
|---|---|---|---|---|
| 2025 | $2,393 | $327,140 | $315,700 | $279,100 |
| 2024 | $2,393 | $295,020 | $0 | $0 |
| 2023 | $2,275 | $301,235 | $0 | $0 |
| 2022 | $2,391 | $305,855 | $0 | $0 |
| 2021 | $2,011 | $387,900 | $198,200 | $189,700 |
| 2020 | $1,875 | $356,000 | $177,000 | $179,000 |
| 2019 | $1,589 | $314,800 | $151,700 | $163,100 |
| 2018 | $1,546 | $288,700 | $134,900 | $153,800 |
| 2017 | $1,434 | $143,605 | $0 | $0 |
| 2016 | $1,362 | $126,115 | $0 | $0 |
| 2015 | $1,440 | $126,115 | $0 | $0 |
| 2014 | $1,241 | $107,635 | $0 | $0 |
Source: Public Records
Map
Nearby Homes