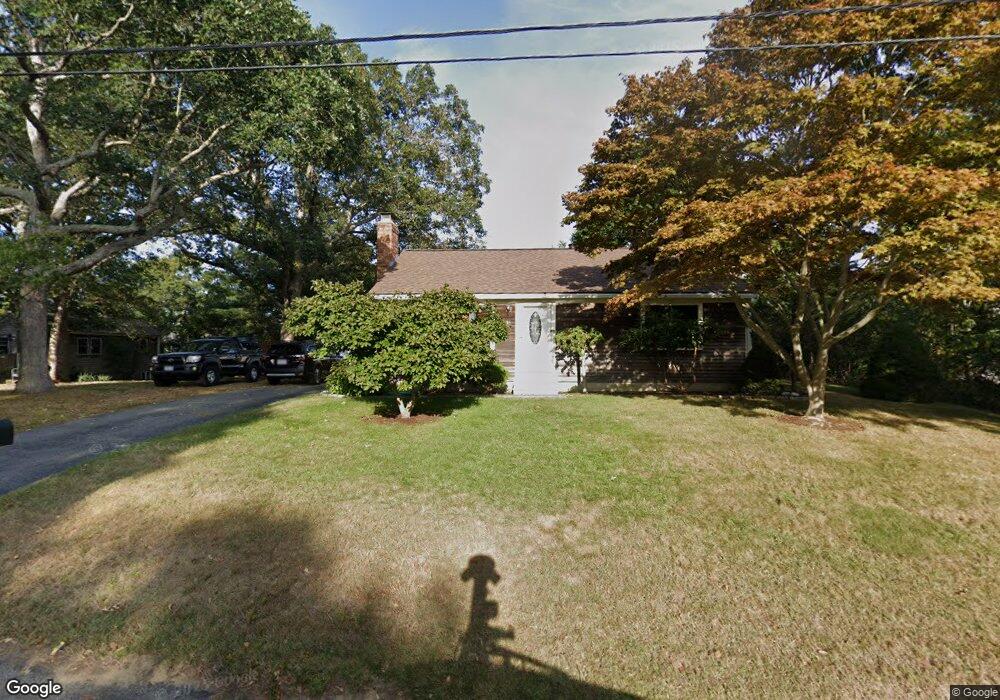
398 W Main St Unit 2C Hyannis, MA 02601
Estimated Value: $279,000 - $547,000
2
Beds
1
Bath
800
Sq Ft
$446/Sq Ft
Est. Value
About This Home
This home is located at 398 W Main St Unit 2C, Hyannis, MA 02601 and is currently estimated at $356,631, approximately $445 per square foot. 398 W Main St Unit 2C is a home located in Barnstable County with nearby schools including Hyannis West Elementary School, Barnstable United Elementary School, and Barnstable Intermediate School.
Ownership History
Date
Name
Owned For
Owner Type
Purchase Details
Closed on
Jul 21, 2003
Sold by
Fernandes Elaine C
Bought by
Dasilva Christianne M
Current Estimated Value
Home Financials for this Owner
Home Financials are based on the most recent Mortgage that was taken out on this home.
Original Mortgage
$132,890
Outstanding Balance
$56,839
Interest Rate
5.34%
Mortgage Type
Purchase Money Mortgage
Estimated Equity
$299,792
Purchase Details
Closed on
Jul 8, 2002
Sold by
Fredette Todd M
Bought by
D-Fernandes Elaine C
Home Financials for this Owner
Home Financials are based on the most recent Mortgage that was taken out on this home.
Original Mortgage
$106,400
Interest Rate
6.82%
Mortgage Type
Purchase Money Mortgage
Purchase Details
Closed on
Dec 6, 1995
Sold by
Park Pl Condo T and Murphy Kelly L
Bought by
Fredette Todd M
Purchase Details
Closed on
Sep 20, 1993
Sold by
Bekshire County Sb
Bought by
Murphy Kelly L
Purchase Details
Closed on
Oct 4, 1991
Sold by
Ostellino Victor M
Bought by
Berkshire Cty Sb
Create a Home Valuation Report for This Property
The Home Valuation Report is an in-depth analysis detailing your home's value as well as a comparison with similar homes in the area
Home Values in the Area
Average Home Value in this Area
Purchase History
| Date | Buyer | Sale Price | Title Company |
|---|---|---|---|
| Dasilva Christianne M | $137,000 | -- | |
| D-Fernandes Elaine C | $112,000 | -- | |
| Fredette Todd M | $21,000 | -- | |
| Murphy Kelly L | $39,000 | -- | |
| Berkshire Cty Sb | $50,000 | -- |
Source: Public Records
Mortgage History
| Date | Status | Borrower | Loan Amount |
|---|---|---|---|
| Open | Berkshire Cty Sb | $132,890 | |
| Previous Owner | Berkshire Cty Sb | $106,400 |
Source: Public Records
Tax History Compared to Growth
Tax History
| Year | Tax Paid | Tax Assessment Tax Assessment Total Assessment is a certain percentage of the fair market value that is determined by local assessors to be the total taxable value of land and additions on the property. | Land | Improvement |
|---|---|---|---|---|
| 2025 | $2,164 | $233,400 | $0 | $233,400 |
| 2024 | $2,005 | $221,600 | $0 | $221,600 |
| 2023 | $1,651 | $172,500 | $0 | $172,500 |
| 2022 | $1,562 | $135,000 | $0 | $135,000 |
| 2021 | $1,558 | $130,800 | $0 | $130,800 |
| 2020 | $1,671 | $135,500 | $0 | $135,500 |
| 2019 | $1,537 | $122,200 | $0 | $122,200 |
| 2018 | $1,449 | $117,800 | $0 | $117,800 |
| 2017 | $1,418 | $118,300 | $0 | $118,300 |
| 2016 | $1,388 | $118,300 | $0 | $118,300 |
| 2015 | $1,347 | $116,400 | $0 | $116,400 |
Source: Public Records
Map
Nearby Homes
- 7 Arbeta Rd
- 295 Sudbury Ln
- 297 W Main St Unit 12
- 83 Peacock Dr
- 68 Seaboard Ln
- 220 Fawcett Ln
- 15 Goldie Way
- 28 Peacock Dr
- 36 Grouse Ln
- 65 Olander Dr
- 75 Olander Dr
- 75 Olander Dr
- 22 Keel Way
- 292 Megan Rd
- 135 W Main St Unit 45
- 296 Lincoln Rd
- 20 Sunset Terrace
- 24 Bettys Pond Rd Unit K
- 24 Betty's Pond Rd Unit 1K
- 260 Tobey Way
- 398 W Main St Unit 5D
- 398 W Main St Unit 5C
- 398 W Main St Unit 5B
- 398 W Main St Unit 5A
- 398 W Main St Unit 4D
- 398 W Main St Unit 4C
- 398 W Main St Unit 4B
- 398 W Main St Unit 4A
- 398 W Main St Unit 3D
- 398 W Main St Unit 3C
- 398 W Main St Unit 3B
- 398 W Main St Unit 3A
- 398 W Main St Unit 2D
- 398 W Main St Unit 2B
- 398 W Main St Unit 2A
- 398 W Main St Unit 1D
- 398 W Main St Unit 1C
- 398 W Main St Unit 1B
- 398 W Main St Unit 1A
- 398 W Main St Unit 5EE