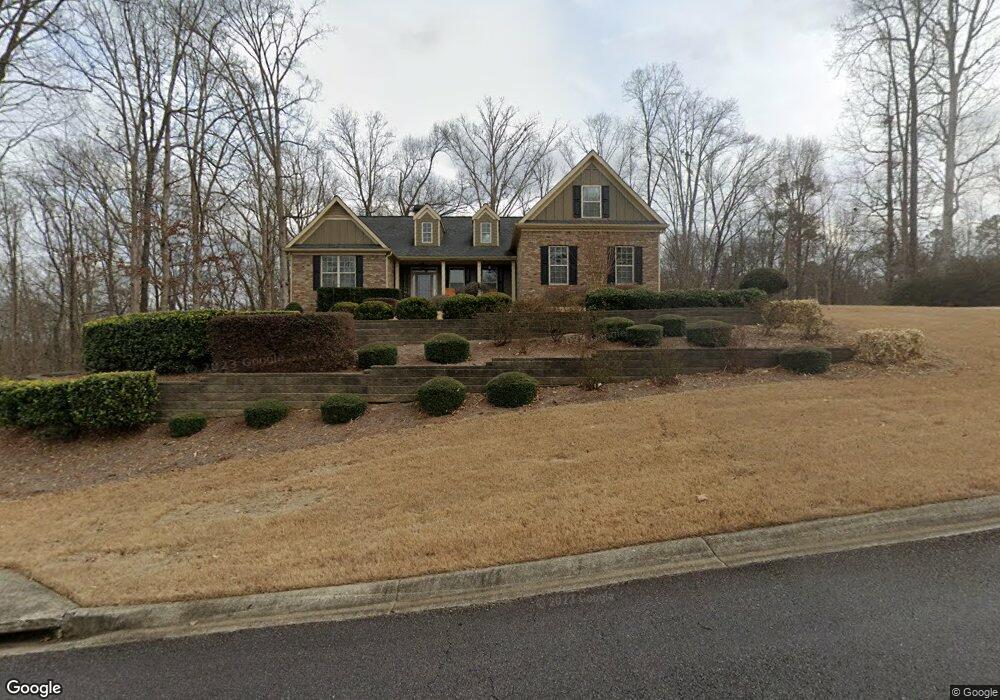
398 Whirlaway St Jefferson, GA 30549
Estimated Value: $554,963 - $634,000
5
Beds
4
Baths
3,101
Sq Ft
$195/Sq Ft
Est. Value
About This Home
This home is located at 398 Whirlaway St, Jefferson, GA 30549 and is currently estimated at $606,241, approximately $195 per square foot. 398 Whirlaway St is a home located in Jackson County with nearby schools including Gum Springs Elementary School, West Jackson Middle School, and Jackson County High School.
Ownership History
Date
Name
Owned For
Owner Type
Purchase Details
Closed on
Nov 5, 2010
Sold by
Fusco Thomas A
Bought by
Wirthman Kathy Anderson
Current Estimated Value
Purchase Details
Closed on
Dec 11, 2008
Sold by
Afb T
Bought by
Fusco Thomas A and Thacker Megan J
Home Financials for this Owner
Home Financials are based on the most recent Mortgage that was taken out on this home.
Original Mortgage
$229,446
Interest Rate
6.1%
Mortgage Type
FHA
Purchase Details
Closed on
Sep 2, 2008
Sold by
Jefferson Builders Llc
Bought by
Afb T
Purchase Details
Closed on
Sep 7, 2005
Sold by
Gary
Bought by
Jefferson Builders Llc
Purchase Details
Closed on
Aug 5, 2005
Sold by
Gary & Olsson Properties Llc
Bought by
Jefferson Builders Llc
Create a Home Valuation Report for This Property
The Home Valuation Report is an in-depth analysis detailing your home's value as well as a comparison with similar homes in the area
Home Values in the Area
Average Home Value in this Area
Purchase History
| Date | Buyer | Sale Price | Title Company |
|---|---|---|---|
| Wirthman Kathy Anderson | $232,500 | -- | |
| Fusco Thomas A | $232,500 | -- | |
| Afb T | $1,289,462 | -- | |
| Jefferson Builders Llc | $1,000,000 | -- | |
| Jefferson Builders Llc | $50,000 | -- |
Source: Public Records
Mortgage History
| Date | Status | Borrower | Loan Amount |
|---|---|---|---|
| Previous Owner | Fusco Thomas A | $229,446 |
Source: Public Records
Tax History Compared to Growth
Tax History
| Year | Tax Paid | Tax Assessment Tax Assessment Total Assessment is a certain percentage of the fair market value that is determined by local assessors to be the total taxable value of land and additions on the property. | Land | Improvement |
|---|---|---|---|---|
| 2024 | $4,976 | $206,840 | $24,000 | $182,840 |
| 2023 | $4,976 | $187,120 | $24,000 | $163,120 |
| 2022 | $4,278 | $155,840 | $24,000 | $131,840 |
| 2021 | $4,309 | $155,840 | $24,000 | $131,840 |
| 2020 | $3,948 | $130,240 | $24,000 | $106,240 |
| 2019 | $4,009 | $130,240 | $24,000 | $106,240 |
| 2018 | $3,904 | $125,080 | $24,000 | $101,080 |
| 2017 | $3,710 | $117,856 | $24,000 | $93,856 |
| 2016 | $3,731 | $117,856 | $24,000 | $93,856 |
| 2015 | $3,296 | $103,856 | $10,000 | $93,856 |
| 2014 | $3,169 | $99,137 | $10,000 | $89,137 |
| 2013 | -- | $99,137 | $10,000 | $89,137 |
Source: Public Records
Map
Nearby Homes
- 420 Whirlaway St
- 340 Whirlaway St
- 347 Whirlaway St
- 320 Whirlaway St
- 450 Whirlaway St
- 28 Seattle Slew Walk
- 43 Seattle Slew Walk
- 303 Whirlaway St
- 50 Seattle Slew Walk
- 474 Whilraway St
- 474 Whirlaway St
- 282 Whirlaway St
- 57 Seattle Slew Walk
- 0 Seattle Slew Walk Unit 8933020
- 0 Seattle Slew Walk Unit 7249015
- 0 Seattle Slew Walk
- 72 Seattle Slew Walk
- 297 Whirlaway St
- 498 Whirlaway St
- 224 Whirlaway St