398 Winn Rd Blairsville, GA 30512
Estimated Value: $803,000 - $1,262,614
4
Beds
4
Baths
3,825
Sq Ft
$270/Sq Ft
Est. Value
About This Home
This home is located at 398 Winn Rd, Blairsville, GA 30512 and is currently estimated at $1,034,654, approximately $270 per square foot. 398 Winn Rd is a home located in Union County with nearby schools including Union County Primary School, Union County Elementary School, and Union County Middle School.
Ownership History
Date
Name
Owned For
Owner Type
Purchase Details
Closed on
Aug 11, 2008
Sold by
Frederick Catherine
Bought by
Cole Robert D
Current Estimated Value
Home Financials for this Owner
Home Financials are based on the most recent Mortgage that was taken out on this home.
Original Mortgage
$144,000
Outstanding Balance
$94,465
Interest Rate
6.32%
Mortgage Type
New Conventional
Estimated Equity
$940,189
Purchase Details
Closed on
Sep 24, 2001
Sold by
Duckworth Carolyn H
Bought by
Inraham Robert L
Purchase Details
Closed on
Jun 18, 2001
Sold by
Dial Catherine D
Bought by
Duckworth Carolyn H
Purchase Details
Closed on
Sep 14, 1994
Bought by
Frederick Catherine
Purchase Details
Closed on
Jul 19, 1994
Bought by
Dial Catherine D
Create a Home Valuation Report for This Property
The Home Valuation Report is an in-depth analysis detailing your home's value as well as a comparison with similar homes in the area
Home Values in the Area
Average Home Value in this Area
Purchase History
| Date | Buyer | Sale Price | Title Company |
|---|---|---|---|
| Cole Robert D | -- | -- | |
| Cole Robert D | $5,000 | -- | |
| Cole Robert D | $180,000 | -- | |
| Inraham Robert L | $14,800 | -- | |
| Duckworth Carolyn H | $6,500 | -- | |
| Frederick Catherine | $65,000 | -- | |
| Dial Catherine D | $6,500 | -- |
Source: Public Records
Mortgage History
| Date | Status | Borrower | Loan Amount |
|---|---|---|---|
| Open | Cole Robert D | $144,000 | |
| Closed | Cole Robert D | $144,000 |
Source: Public Records
Tax History Compared to Growth
Tax History
| Year | Tax Paid | Tax Assessment Tax Assessment Total Assessment is a certain percentage of the fair market value that is determined by local assessors to be the total taxable value of land and additions on the property. | Land | Improvement |
|---|---|---|---|---|
| 2024 | $5,713 | $483,800 | $57,440 | $426,360 |
| 2023 | $6,317 | $474,480 | $57,440 | $417,040 |
| 2022 | $4,960 | $372,560 | $53,200 | $319,360 |
| 2021 | $4,436 | $281,520 | $30,480 | $251,040 |
| 2020 | $4,262 | $225,286 | $44,457 | $180,829 |
| 2019 | $3,886 | $217,286 | $44,457 | $172,829 |
| 2018 | $3,817 | $217,286 | $44,457 | $172,829 |
| 2017 | $3,782 | $215,322 | $44,457 | $170,865 |
| 2016 | $3,756 | $213,722 | $44,457 | $169,265 |
| 2015 | $3,529 | $199,106 | $33,184 | $165,922 |
| 2013 | -- | $56,487 | $33,184 | $23,303 |
Source: Public Records
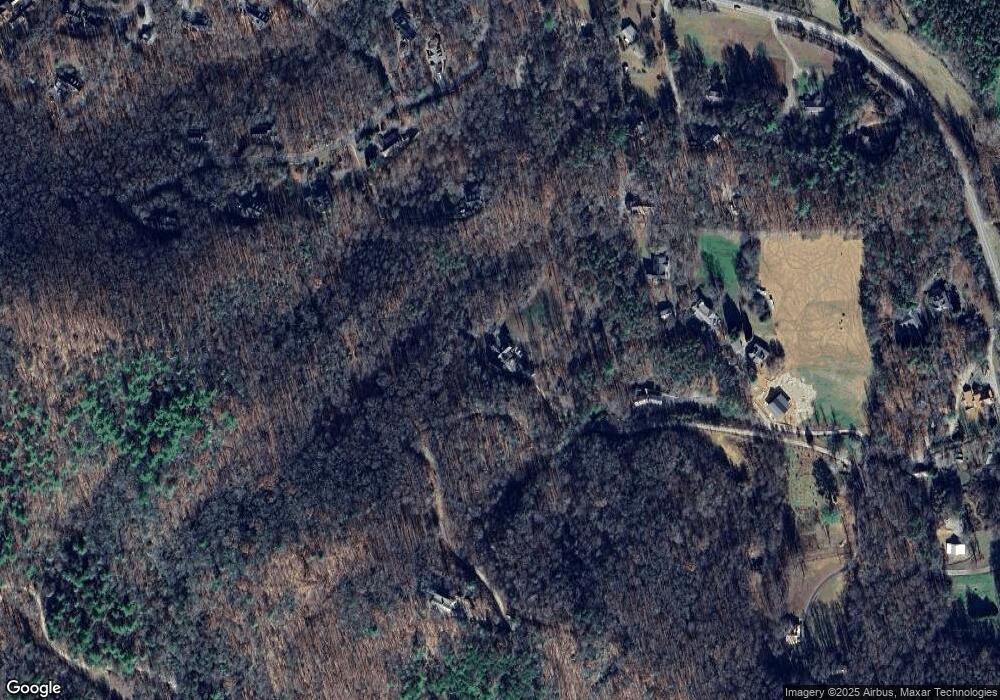
Map
Nearby Homes
- 77 Alpine Way
- 16 Misty Mountain Ln
- 55 Misty Mountain Ln
- 397 Everetts View
- 275 Everetts View
- 74 Timber Ln
- 105 Hidden Valley Acres
- Lot 13 Wilderness Ridge Sub
- 33 Frontier Way Unit 13
- 33 Frontier Way
- 74 Frontier Way
- 160 Largen Rd
- Tract II Schuler Rd
- L2&3 Crab Apple Rd
- 102 Maple Ln
- 33 Dover Rd
- Tract 4 Fain Branch Rd
- Tract 1 Fain Branch Rd
- Tract 2 Fain Branch Rd
- Tract 3 Fain Branch Rd
- 51 Wildwood Springs
- 115 Ledge Ln
- 70 Ledge Ln
- 70 Ledge Ln
- 114 Town Creek View
- 17 Wildwood Springs
- 17 Wildwood Springs
- 185 Wildwood Brook
- 46 Ledge Ln
- 457 Fletcher Mountain Rd
- 0 Wildwood Brook Unit 291835
- 0 Wildwood Brook Unit 6988480
- 0 Wildwood Brook Unit 8770709
- 70 Town Creek View
- 0 Alpine Way
- 315 Wildwood Brook
- 2895 Wildwood Brook
- 81 Town Creek View
- 100 Wildwood Brook
- 77 Alpine Way Unit 3