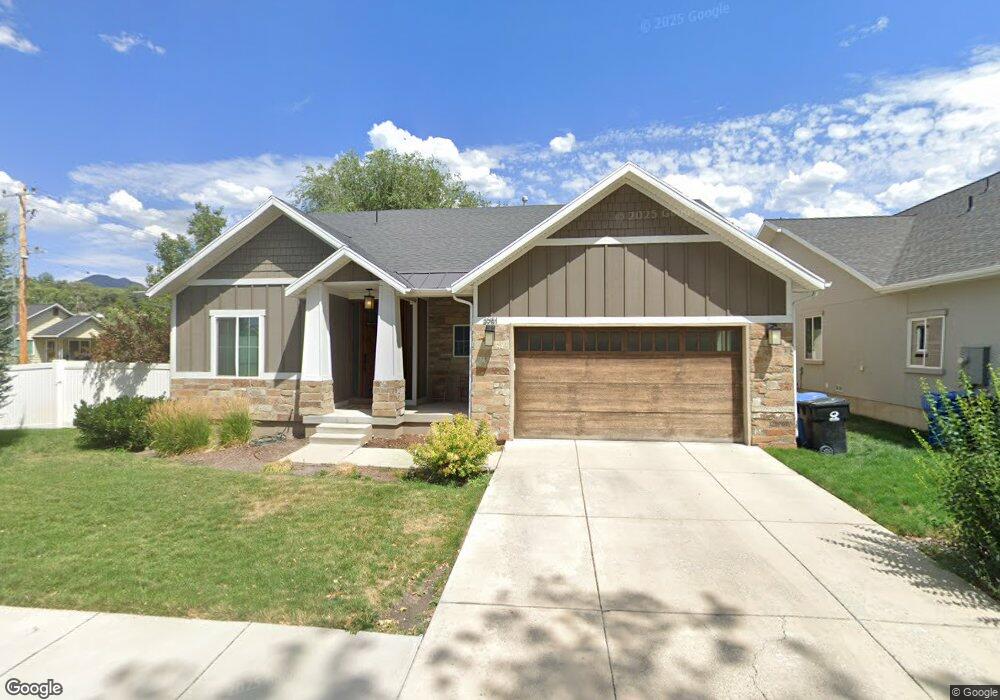
3981 S Orchard Park Ct Holladay, UT 84124
Estimated Value: $779,000 - $1,079,000
4
Beds
3
Baths
3,559
Sq Ft
$263/Sq Ft
Est. Value
About This Home
This home is located at 3981 S Orchard Park Ct, Holladay, UT 84124 and is currently estimated at $935,589, approximately $262 per square foot. 3981 S Orchard Park Ct is a home located in Salt Lake County with nearby schools including Crestview Elementary School, Olympus Junior High School, and Olympus High School.
Ownership History
Date
Name
Owned For
Owner Type
Purchase Details
Closed on
Jun 8, 2019
Sold by
Avery Jay
Bought by
Avery Maria Ann
Current Estimated Value
Purchase Details
Closed on
Nov 5, 2012
Sold by
R J Folk Llc
Bought by
Avery Jay
Purchase Details
Closed on
Feb 10, 2012
Sold by
Element Capital Llc
Bought by
R J Folk Llc
Home Financials for this Owner
Home Financials are based on the most recent Mortgage that was taken out on this home.
Original Mortgage
$315,330
Interest Rate
8%
Mortgage Type
Stand Alone First
Purchase Details
Closed on
Feb 7, 2012
Sold by
Bokf Na
Bought by
Element Capital Llc
Home Financials for this Owner
Home Financials are based on the most recent Mortgage that was taken out on this home.
Original Mortgage
$315,330
Interest Rate
8%
Mortgage Type
Stand Alone First
Purchase Details
Closed on
Jan 7, 2011
Sold by
Orchard Court Llc
Bought by
Bank Of Oklahoma Na
Create a Home Valuation Report for This Property
The Home Valuation Report is an in-depth analysis detailing your home's value as well as a comparison with similar homes in the area
Home Values in the Area
Average Home Value in this Area
Purchase History
| Date | Buyer | Sale Price | Title Company |
|---|---|---|---|
| Avery Maria Ann | -- | Novation Title Ins Agcy | |
| Avery Jay | -- | Title West | |
| R J Folk Llc | -- | First American Ncs | |
| Element Capital Llc | -- | First American Ncs | |
| Bank Of Oklahoma Na | $560,000 | First American Ncs |
Source: Public Records
Mortgage History
| Date | Status | Borrower | Loan Amount |
|---|---|---|---|
| Previous Owner | Element Capital Llc | $315,330 |
Source: Public Records
Tax History Compared to Growth
Tax History
| Year | Tax Paid | Tax Assessment Tax Assessment Total Assessment is a certain percentage of the fair market value that is determined by local assessors to be the total taxable value of land and additions on the property. | Land | Improvement |
|---|---|---|---|---|
| 2025 | $5,336 | $971,100 | $202,200 | $768,900 |
| 2024 | $5,336 | $854,400 | $195,900 | $658,500 |
| 2023 | $5,041 | $779,100 | $154,400 | $624,700 |
| 2022 | $5,156 | $801,100 | $151,400 | $649,700 |
| 2021 | $5,104 | $687,500 | $116,500 | $571,000 |
| 2020 | $4,927 | $626,400 | $111,100 | $515,300 |
| 2019 | $5,147 | $640,300 | $103,300 | $537,000 |
| 2018 | $5,145 | $615,300 | $103,300 | $512,000 |
| 2017 | $1,338 | $579,300 | $103,300 | $476,000 |
| 2016 | $4,380 | $554,100 | $103,300 | $450,800 |
| 2015 | $4,856 | $575,000 | $135,600 | $439,400 |
| 2014 | $4,638 | $537,100 | $129,200 | $407,900 |
Source: Public Records
Map
Nearby Homes
- 4008 S Vernon Cir Unit C
- 1562 E 3900 S Unit 105
- 1562 E 3900 S Unit 106
- 1562 E 3900 S Unit 104
- 1562 E 3900 S Unit 107
- 4128 S Winder Ward Dr Unit 2-122
- 4097 S Highland Dr Unit 3A
- 4132 S Winder Ward Dr Unit 2-120
- 1555 E 3900 S Unit 208
- Turner 2 Plan at Axis
- 1648 E 4150 S
- 1550 E 4160 S
- 1426 E Komenda Way Unit 19
- 1371 E Skyview Dr
- 1818 E 3900 S
- 1801 E 3900 S
- 1363 E 4170 S Unit 1365
- 4129 Colt Haven Cir
- 1466 E 4230 S
- 1460 E Highland Ln S Unit 319
- 3981 S Orchard Park Ct Unit 6
- 3981 S Orchard Park Ct Unit 1
- 3991 S Orchard Park Ct
- 3991 S Orchard Park Ct Unit 2
- 3991 S Orchard Park Ct
- 3980 Vernon Cir Unit D
- 3980 Vernon Cir Unit C
- 3980 Vernon Cir Unit B
- 3980 Vernon Cir Unit A
- 3980 Vernon Cir
- 3980 S Vernon Cir
- 3980 S Vernon Cir Unit B
- 3980 S Vernon Cir Unit A
- 3980 S Vernon Cir Unit C
- 3980 S Vernon Cir Unit D
- 3993 S Orchard Park Ct
- 3998 S Vernon Cir Unit D E
- 3998 S Vernon Cir
- 3998 S Vernon Cir Unit D
- 3998 S Vernon Cir Unit B