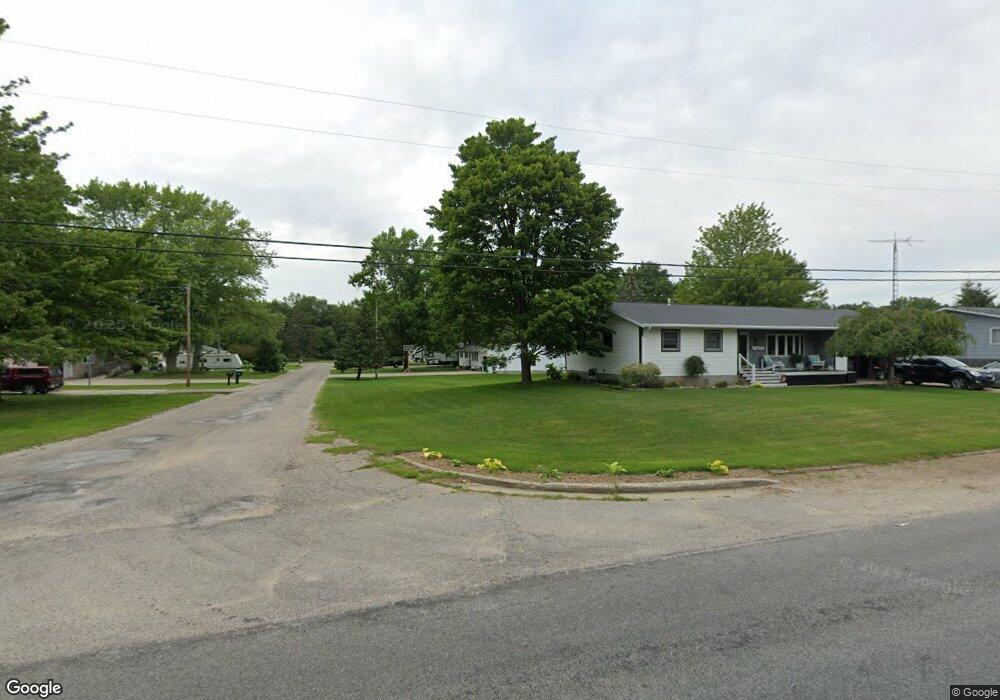
3982 Manning St Muskegon, MI 49444
Estimated Value: $286,000 - $324,000
3
Beds
2
Baths
1,144
Sq Ft
$269/Sq Ft
Est. Value
About This Home
This home is located at 3982 Manning St, Muskegon, MI 49444 and is currently estimated at $307,522, approximately $268 per square foot. 3982 Manning St is a home located in Muskegon County with nearby schools including Fruitport High School, Broadway Baptist School, and Muskegon Sda School.
Ownership History
Date
Name
Owned For
Owner Type
Purchase Details
Closed on
Sep 8, 2015
Sold by
Doctor Robert and Doctor Henrietta
Bought by
Doctor Thomas Robert and Doctor Jeanine
Current Estimated Value
Purchase Details
Closed on
May 25, 2007
Sold by
Hud
Bought by
Doctor Thomas and Doctor Jeanine A
Home Financials for this Owner
Home Financials are based on the most recent Mortgage that was taken out on this home.
Original Mortgage
$84,800
Outstanding Balance
$51,694
Interest Rate
6.21%
Mortgage Type
Purchase Money Mortgage
Estimated Equity
$255,828
Purchase Details
Closed on
Jun 27, 2006
Sold by
Mortgage Electronic Registration Systems
Bought by
Hud
Purchase Details
Closed on
May 26, 2006
Sold by
Martinez Corrie A and Martinez Carlos
Bought by
Mortgage Electronic Registration Systems
Purchase Details
Closed on
Aug 27, 2004
Sold by
Hanes Corine and Miller Corine
Bought by
Martinez Carlos and Martinez Corrie A
Home Financials for this Owner
Home Financials are based on the most recent Mortgage that was taken out on this home.
Original Mortgage
$127,900
Interest Rate
6.1%
Mortgage Type
FHA
Create a Home Valuation Report for This Property
The Home Valuation Report is an in-depth analysis detailing your home's value as well as a comparison with similar homes in the area
Home Values in the Area
Average Home Value in this Area
Purchase History
| Date | Buyer | Sale Price | Title Company |
|---|---|---|---|
| Doctor Thomas Robert | $7,500 | Attorney | |
| Doctor Thomas | -- | None Available | |
| Hud | -- | None Available | |
| Mortgage Electronic Registration Systems | $133,404 | None Available | |
| Martinez Carlos | $129,000 | Muskegon Land Title Agency L |
Source: Public Records
Mortgage History
| Date | Status | Borrower | Loan Amount |
|---|---|---|---|
| Open | Doctor Thomas | $84,800 | |
| Previous Owner | Martinez Carlos | $127,900 |
Source: Public Records
Tax History Compared to Growth
Tax History
| Year | Tax Paid | Tax Assessment Tax Assessment Total Assessment is a certain percentage of the fair market value that is determined by local assessors to be the total taxable value of land and additions on the property. | Land | Improvement |
|---|---|---|---|---|
| 2025 | $2,640 | $137,600 | $0 | $0 |
| 2024 | $1,840 | $127,800 | $0 | $0 |
| 2023 | $1,759 | $111,700 | $0 | $0 |
| 2022 | $2,315 | $100,400 | $0 | $0 |
| 2021 | $2,252 | $93,000 | $0 | $0 |
| 2020 | $2,229 | $85,200 | $0 | $0 |
| 2019 | $2,189 | $79,900 | $0 | $0 |
| 2018 | $2,098 | $76,400 | $0 | $0 |
| 2017 | $2,055 | $73,000 | $0 | $0 |
| 2016 | $1,249 | $65,700 | $0 | $0 |
| 2015 | -- | $63,600 | $0 | $0 |
| 2014 | -- | $50,000 | $0 | $0 |
| 2013 | -- | $44,800 | $0 | $0 |
Source: Public Records
Map
Nearby Homes
- V/L S Sheridan Dr
- 2355 Cress Creek Dr
- 2322 Cline Rd
- 4441 S Sheridan Dr
- 2523 Heights Ravenna Rd
- 3471 Kersting Dr
- 4563 Keener St
- 3835 Ellen St
- 3705 S Dangl Rd
- 3241 Medema St
- 2171 Monte Ave
- 3249 de Feyter St
- 4697 S Quarterline Rd
- 3222 George St
- 2509 August Ave
- 3658 Stephanie Ln
- 1454 Airport Rd
- 5005 Airline Rd
- 3176 Klug St
- 2338 E Columbia Ave
- 3964 Manning St
- 2470 Shettler Rd
- 2484 Shettler Rd
- 3983 Thona St
- 3965 Thona St
- 3948 Manning St
- 3985 Manning St
- 2500 Shettler Rd
- 3967 Manning St
- 3989 Manning St
- 3949 Thona St
- 3951 Manning St
- 2491 Shettler Rd
- 2475 Shettler Rd
- 2501 Shettler Rd
- 3964 S Sheridan Dr
- 3936 S Sheridan Dr
- 2443 Shettler Rd
- 2526 Shettler Rd
- 3982 Thona St