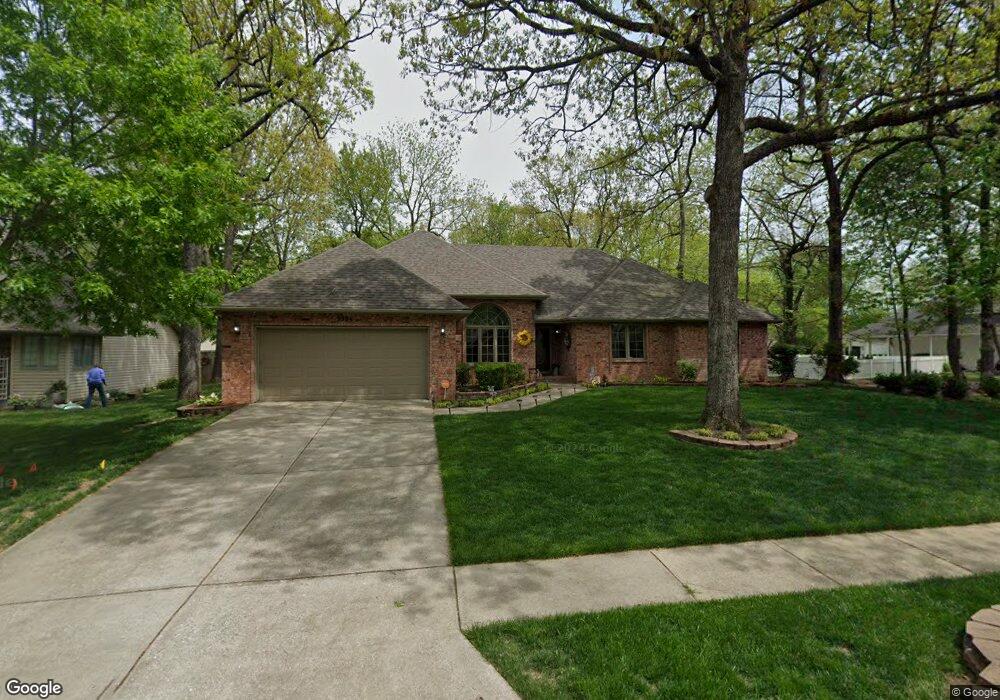
3984 N Williams Place Springfield, MO 65803
Estimated Value: $293,492 - $348,000
3
Beds
2
Baths
1,941
Sq Ft
$169/Sq Ft
Est. Value
About This Home
This home is located at 3984 N Williams Place, Springfield, MO 65803 and is currently estimated at $328,623, approximately $169 per square foot. 3984 N Williams Place is a home located in Greene County with nearby schools including Truman Elementary School, Pleasant View Elementary School, and Pleasant View K-8 School.
Ownership History
Date
Name
Owned For
Owner Type
Purchase Details
Closed on
Dec 16, 2020
Sold by
Rosebrough Donald B and Rosebrough Dayla M
Bought by
Rosebrough Donald B and Rosebrough Dayla M
Current Estimated Value
Home Financials for this Owner
Home Financials are based on the most recent Mortgage that was taken out on this home.
Original Mortgage
$147,700
Interest Rate
2.2%
Mortgage Type
New Conventional
Purchase Details
Closed on
Nov 22, 2019
Sold by
Rosebrough Donald B and Rosebrough Dayla M
Bought by
Rosebrough Donald B and Rosebrough Dayla M
Home Financials for this Owner
Home Financials are based on the most recent Mortgage that was taken out on this home.
Original Mortgage
$131,887
Interest Rate
3.6%
Purchase Details
Closed on
Nov 26, 2008
Sold by
Rosebrough Donald B and Rosebrough Dayla M
Bought by
Rosebrough Donald B and Rosebrough Dayla M
Create a Home Valuation Report for This Property
The Home Valuation Report is an in-depth analysis detailing your home's value as well as a comparison with similar homes in the area
Home Values in the Area
Average Home Value in this Area
Purchase History
| Date | Buyer | Sale Price | Title Company |
|---|---|---|---|
| Rosebrough Donald B | -- | None Available | |
| Donald B Rosebrough And Dayla M Rosebrough Tr | -- | None Listed On Document | |
| Quicken Loans Llc | -- | None Available | |
| Rosebrough Donald B | -- | None Listed On Document | |
| Rosebrough Donald B | -- | Amrock | |
| Rosebrough Donald B | -- | Amrock | |
| Rosebrough Donald B | -- | None Available |
Source: Public Records
Mortgage History
| Date | Status | Borrower | Loan Amount |
|---|---|---|---|
| Previous Owner | Rosebrough Donald B | $147,700 | |
| Previous Owner | Rosebrough Donald B | $131,887 |
Source: Public Records
Tax History Compared to Growth
Tax History
| Year | Tax Paid | Tax Assessment Tax Assessment Total Assessment is a certain percentage of the fair market value that is determined by local assessors to be the total taxable value of land and additions on the property. | Land | Improvement |
|---|---|---|---|---|
| 2025 | $1,983 | $40,450 | $6,650 | $33,800 |
| 2024 | $1,983 | $34,260 | $2,850 | $31,410 |
| 2023 | $1,973 | $34,260 | $2,850 | $31,410 |
| 2022 | $1,739 | $29,600 | $2,850 | $26,750 |
| 2021 | $1,664 | $29,600 | $2,850 | $26,750 |
| 2020 | $1,710 | $28,880 | $2,850 | $26,030 |
| 2019 | $1,662 | $28,880 | $2,850 | $26,030 |
| 2018 | $1,670 | $28,880 | $4,370 | $24,510 |
| 2017 | $1,655 | $27,250 | $4,370 | $22,880 |
| 2016 | $1,559 | $27,250 | $4,370 | $22,880 |
| 2015 | $1,548 | $27,250 | $4,370 | $22,880 |
| 2014 | $1,556 | $27,250 | $4,370 | $22,880 |
Source: Public Records
Map
Nearby Homes
- 3879 N Williams Ct
- 3877 N Daniels Ct
- 1158 W Bradley St
- 845 W Farm Road 96
- 1352 W Vancouver St
- 3671 N Farm Road 147
- 3740 N Oak Point Ave
- 3486 N Farm Road 143
- 3645 N Oak Point Ave
- 3548 N Lexington Ave
- 3582 N Thistlewood Ct
- 611 W Bridgewood Ct
- 252 E Saddle Ln
- 2586 E Theran Ave Unit (Ph 1, Lot 14)
- 337 E Farm Road 96
- 3764 N Huntington Ave
- 1632 N Grant Ave
- 3622 N Huntington Ave
- 213 W Mazzy Dr
- 4449 N Toby Ave
- 5369 N Seitz Ave Unit Lot 5
- 5326 N Seitz Ave
- 5369 N Seitz Ave
- 3996 N Williams Place
- 3960 N Williams Place
- 1117 W Woodbine St
- 0 Windsor On the Hill Unit 10807764
- 0 Windsor On the Hill Unit 10807775
- 0 Windsor On the Hill Unit 10807774
- 0 Windsor On the Hill Unit 10823435
- 0 Windsor On the Hill Unit 10823429
- 0 Windsor On the Hill Unit 10823437
- 0 Windsor On the Hill Unit 10823436
- 0 Windsor On the Hill Unit 10823426
- 0 Windsor On the Hill Unit 10823444
- 0 Windsor On the Hill Unit 10823443
- 0 Windsor On the Hill Unit 10823442
- 0 Windsor On the Hill Unit 10823424
- 0 Windsor On the Hill Unit 10823419
- 0 Windsor On the Hill Unit 10823421