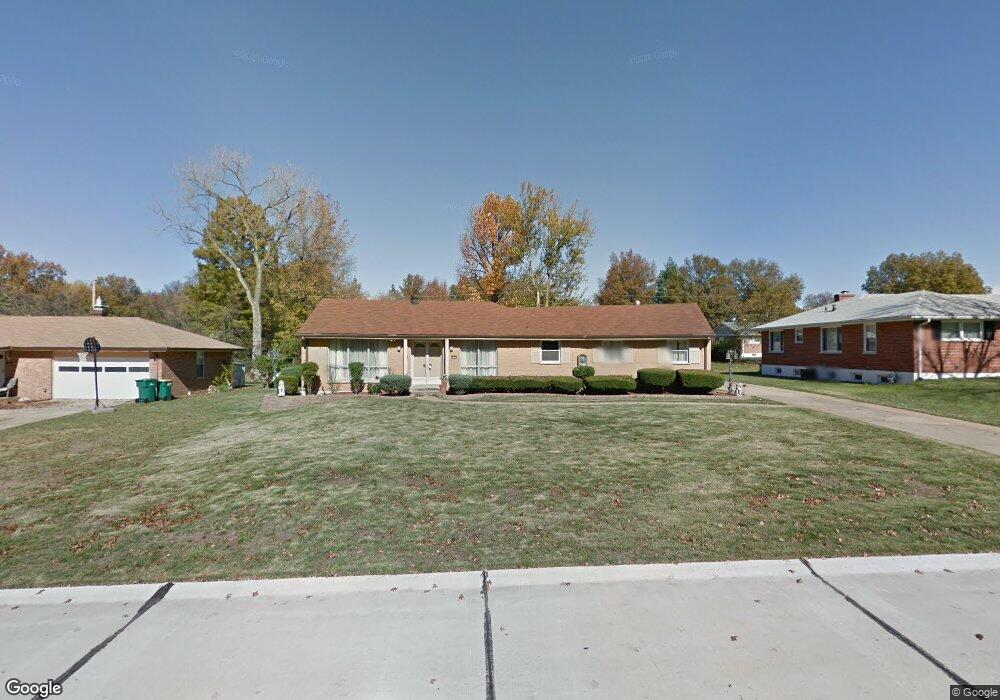
3985 Nara Dr Florissant, MO 63033
Estimated Value: $224,000 - $240,000
3
Beds
3
Baths
1,873
Sq Ft
$126/Sq Ft
Est. Value
About This Home
This home is located at 3985 Nara Dr, Florissant, MO 63033 and is currently estimated at $235,150, approximately $125 per square foot. 3985 Nara Dr is a home located in St. Louis County with nearby schools including Commons Lane Elementary School, Cross Keys Middle School, and McCluer North High School.
Ownership History
Date
Name
Owned For
Owner Type
Purchase Details
Closed on
Nov 8, 2005
Sold by
Dungins Deandre
Bought by
Dungins Deandre and Dungins Shevon
Current Estimated Value
Home Financials for this Owner
Home Financials are based on the most recent Mortgage that was taken out on this home.
Original Mortgage
$171,000
Outstanding Balance
$106,904
Interest Rate
8.45%
Mortgage Type
Stand Alone First
Estimated Equity
$128,246
Purchase Details
Closed on
Feb 15, 2005
Sold by
Connor Michael T and Connor Michelle M
Bought by
Dungins Deandre
Home Financials for this Owner
Home Financials are based on the most recent Mortgage that was taken out on this home.
Original Mortgage
$135,000
Interest Rate
8.93%
Mortgage Type
Fannie Mae Freddie Mac
Purchase Details
Closed on
Jan 9, 2001
Sold by
Wells John L & Peggy Ann Trustees
Bought by
Connor Michael T
Home Financials for this Owner
Home Financials are based on the most recent Mortgage that was taken out on this home.
Original Mortgage
$125,504
Interest Rate
7.55%
Mortgage Type
FHA
Create a Home Valuation Report for This Property
The Home Valuation Report is an in-depth analysis detailing your home's value as well as a comparison with similar homes in the area
Home Values in the Area
Average Home Value in this Area
Purchase History
| Date | Buyer | Sale Price | Title Company |
|---|---|---|---|
| Dungins Deandre | -- | Integrity Land Title Co Inc | |
| Dungins Deandre | $135,000 | Residential Title Svcs Inc | |
| Connor Michael T | $126,500 | -- | |
| Connor Michael T | -- | -- |
Source: Public Records
Mortgage History
| Date | Status | Borrower | Loan Amount |
|---|---|---|---|
| Open | Dungins Deandre | $171,000 | |
| Previous Owner | Dungins Deandre | $135,000 | |
| Previous Owner | Connor Michael T | $125,504 |
Source: Public Records
Tax History Compared to Growth
Tax History
| Year | Tax Paid | Tax Assessment Tax Assessment Total Assessment is a certain percentage of the fair market value that is determined by local assessors to be the total taxable value of land and additions on the property. | Land | Improvement |
|---|---|---|---|---|
| 2025 | $2,884 | $40,240 | $4,960 | $35,280 |
| 2024 | $2,884 | $36,500 | $5,720 | $30,780 |
| 2023 | $2,866 | $36,500 | $5,720 | $30,780 |
| 2022 | $2,721 | $30,380 | $6,670 | $23,710 |
| 2021 | $2,589 | $30,380 | $6,670 | $23,710 |
| 2020 | $2,467 | $26,940 | $5,720 | $21,220 |
| 2019 | $2,417 | $26,940 | $5,720 | $21,220 |
| 2018 | $2,283 | $22,860 | $3,440 | $19,420 |
| 2017 | $2,271 | $22,860 | $3,440 | $19,420 |
| 2016 | $1,972 | $19,250 | $3,040 | $16,210 |
| 2015 | $1,981 | $19,250 | $3,040 | $16,210 |
| 2014 | $2,218 | $21,490 | $4,330 | $17,160 |
Source: Public Records
Map
Nearby Homes
- 3870 Woodcrest Dr
- 3940 Parker Rd
- 3 Wild Ridge Estates Turnberry Ct
- Lot 6 Wildridge Estates
- 1540 Ascot Terrace
- 0TBB Wild Ridge Hazeltine
- 0 Wild Ridge Sawgrass
- 0 Wild Ridge Pikewood Unit MAR23017155
- 0 Wild Ridge Pikewood Unit MAR23017151
- LOT 32 Wild Ridge Willowbrook
- 0TBB Wild Ridge Bethpage
- 0LOT Wild Ridge Turnberry
- 2 Wild Ridge Sawgrass
- Lot 8 Wild Ridge Hazeltine
- 0TBB Wild Ridge Sawgrass
- 8 Wild Ridge Bethpage
- 7 Wild Ridge Willowbrook
- 1 Wild Ridge Sawgrass
- 5 Wild Ridge Willowbrook
- 4 Wild Ridge Bethpage