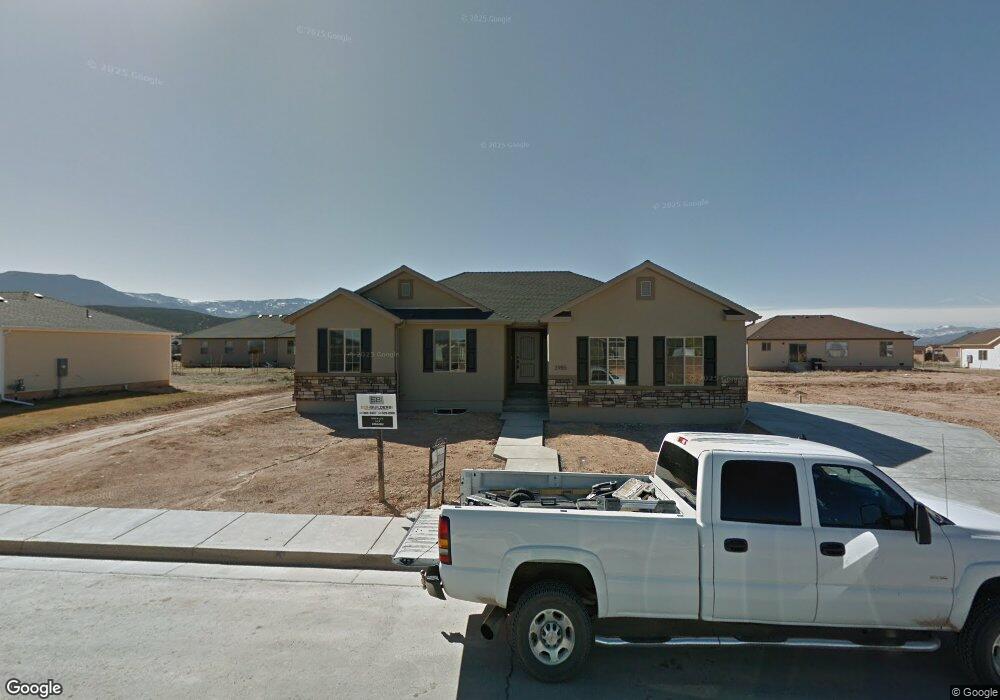
3985 W 25 S Unit Lot 9 Mtn. Shadows Cedar City, UT 84720
Estimated Value: $483,841 - $518,000
3
Beds
2
Baths
3,088
Sq Ft
$162/Sq Ft
Est. Value
About This Home
This home is located at 3985 W 25 S Unit Lot 9 Mtn. Shadows, Cedar City, UT 84720 and is currently estimated at $501,460, approximately $162 per square foot. 3985 W 25 S Unit Lot 9 Mtn. Shadows is a home located in Iron County with nearby schools including Iron Springs School, Cedar Middle School, and Cedar City High School.
Ownership History
Date
Name
Owned For
Owner Type
Purchase Details
Closed on
Sep 29, 2020
Sold by
Larson Brendon B and Larson Megan
Bought by
Larson Brendon B
Current Estimated Value
Home Financials for this Owner
Home Financials are based on the most recent Mortgage that was taken out on this home.
Original Mortgage
$175,000
Outstanding Balance
$125,779
Interest Rate
2.9%
Mortgage Type
New Conventional
Estimated Equity
$375,681
Purchase Details
Closed on
Sep 20, 2020
Sold by
Larson Brendon B
Bought by
Larson Brendon B and Larson Megan
Home Financials for this Owner
Home Financials are based on the most recent Mortgage that was taken out on this home.
Original Mortgage
$175,000
Outstanding Balance
$125,779
Interest Rate
2.9%
Mortgage Type
New Conventional
Estimated Equity
$375,681
Purchase Details
Closed on
Jan 27, 2012
Sold by
Anb Venture Llc
Bought by
Son Builders Inc
Create a Home Valuation Report for This Property
The Home Valuation Report is an in-depth analysis detailing your home's value as well as a comparison with similar homes in the area
Home Values in the Area
Average Home Value in this Area
Purchase History
| Date | Buyer | Sale Price | Title Company |
|---|---|---|---|
| Larson Brendon B | -- | Security Escrow & Ttl Ins Ag | |
| Larson Brendon B | -- | Security Escrow & Ttl Ins Ag | |
| Son Builders Inc | -- | First American Title Company |
Source: Public Records
Mortgage History
| Date | Status | Borrower | Loan Amount |
|---|---|---|---|
| Open | Larson Brendon B | $175,000 |
Source: Public Records
Tax History Compared to Growth
Tax History
| Year | Tax Paid | Tax Assessment Tax Assessment Total Assessment is a certain percentage of the fair market value that is determined by local assessors to be the total taxable value of land and additions on the property. | Land | Improvement |
|---|---|---|---|---|
| 2025 | $2,193 | $281,931 | $56,114 | $225,817 |
| 2023 | $2,251 | $305,260 | $48,795 | $256,465 |
| 2022 | $2,406 | $261,750 | $40,660 | $221,090 |
| 2021 | $1,861 | $202,490 | $17,835 | $184,655 |
| 2020 | $1,850 | $178,470 | $17,835 | $160,635 |
| 2019 | $1,776 | $163,870 | $17,835 | $146,035 |
| 2018 | $1,679 | $149,805 | $17,835 | $131,970 |
| 2017 | $1,563 | $137,330 | $17,090 | $120,240 |
| 2016 | $1,537 | $125,795 | $16,215 | $109,580 |
| 2015 | $1,592 | $123,550 | $0 | $0 |
| 2014 | $1,113 | $80,780 | $0 | $0 |
Source: Public Records
Map
Nearby Homes
- 3985 W 25 S
- 3963 W 25 S Unit Lot 8
- 3963 W 25 S
- 4009 W 25 S
- 3984 W 50 S Unit Lot 12 Mtn. Shadows
- 3984 W 50 S
- 4008 W 50 S Unit Phase III
- 4008 W 50 S Unit Lot 11 MS Phase III
- 4008 W 50 S
- 3962 W 50 S Unit Ph 3
- 3962 W 50 S
- 3962 W 50 S Unit Lot 13 Mountain Sha
- 3986 W 25 S
- 3986 W 25 S Unit Lot 2 Mtn. Shadows
- 3964 W 25 S
- 3928 W 50 S
- 4031 W 25 S
- 3939 W 25 S
- 4032 W 50 S
- 3938 W 50 S