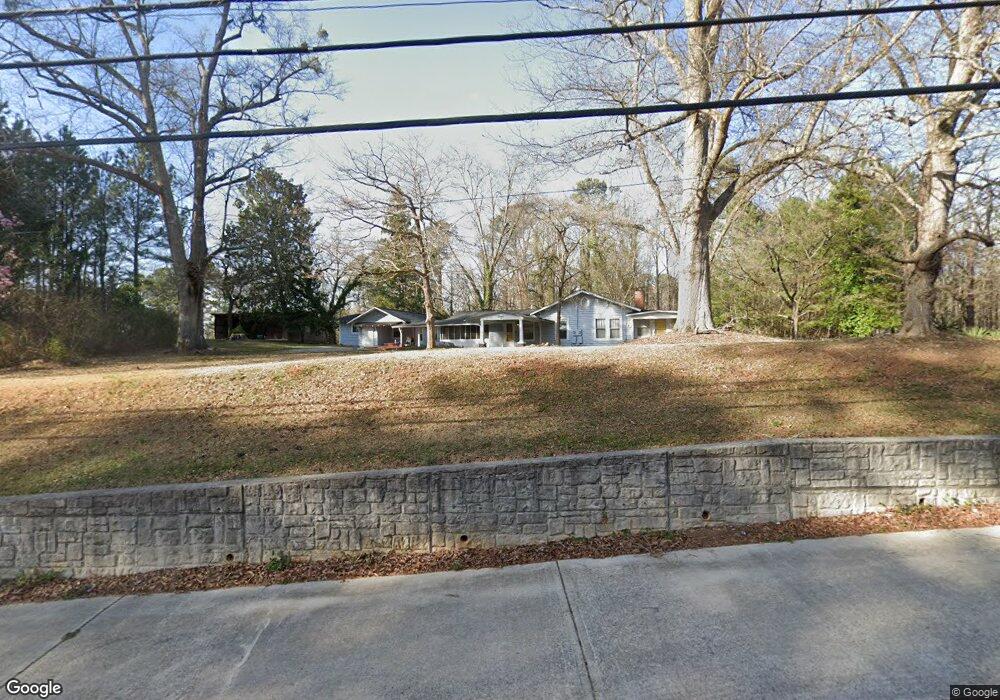
3985 Will Lee Rd Atlanta, GA 30349
Estimated Value: $193,784 - $278,000
3
Beds
1
Bath
1,443
Sq Ft
$154/Sq Ft
Est. Value
About This Home
This home is located at 3985 Will Lee Rd, Atlanta, GA 30349 and is currently estimated at $222,446, approximately $154 per square foot. 3985 Will Lee Rd is a home located in Fulton County with nearby schools including Lee Elementary School, Camp Creek Middle School, and Langston Hughes High School.
Ownership History
Date
Name
Owned For
Owner Type
Purchase Details
Closed on
Jan 2, 2024
Sold by
Thompson Valerie J
Bought by
Isom Valerie J
Current Estimated Value
Purchase Details
Closed on
Dec 17, 2010
Sold by
Federal Natl Mtg Assn Fnma
Bought by
Thompson Valerie J
Home Financials for this Owner
Home Financials are based on the most recent Mortgage that was taken out on this home.
Original Mortgage
$45,000
Interest Rate
4.18%
Mortgage Type
New Conventional
Purchase Details
Closed on
Jul 6, 2010
Sold by
Everhome Mtg Co
Bought by
Federal Natl Mtg Assn Fnma
Purchase Details
Closed on
Mar 18, 2004
Sold by
Knowles Joseph B
Bought by
Isom Karen
Home Financials for this Owner
Home Financials are based on the most recent Mortgage that was taken out on this home.
Original Mortgage
$130,000
Interest Rate
5.53%
Mortgage Type
New Conventional
Create a Home Valuation Report for This Property
The Home Valuation Report is an in-depth analysis detailing your home's value as well as a comparison with similar homes in the area
Home Values in the Area
Average Home Value in this Area
Purchase History
| Date | Buyer | Sale Price | Title Company |
|---|---|---|---|
| Isom Valerie J | -- | -- | |
| Thompson Valerie J | -- | -- | |
| Thompson Valerie J | -- | -- | |
| Federal Natl Mtg Assn Fnma | -- | -- | |
| Everhome Mtg Co | $120,635 | -- | |
| Isom Karen | $130,000 | -- |
Source: Public Records
Mortgage History
| Date | Status | Borrower | Loan Amount |
|---|---|---|---|
| Previous Owner | Thompson Valerie J | $45,000 | |
| Previous Owner | Isom Karen | $130,000 |
Source: Public Records
Tax History Compared to Growth
Tax History
| Year | Tax Paid | Tax Assessment Tax Assessment Total Assessment is a certain percentage of the fair market value that is determined by local assessors to be the total taxable value of land and additions on the property. | Land | Improvement |
|---|---|---|---|---|
| 2025 | $2,045 | $53,080 | $17,840 | $35,240 |
| 2023 | $1,380 | $48,880 | $17,200 | $31,680 |
| 2022 | $1,355 | $34,560 | $8,560 | $26,000 |
| 2021 | $990 | $24,720 | $6,560 | $18,160 |
| 2020 | $855 | $21,000 | $6,120 | $14,880 |
| 2019 | $829 | $21,000 | $6,120 | $14,880 |
| 2018 | $836 | $29,320 | $8,560 | $20,760 |
| 2017 | $856 | $21,000 | $6,120 | $14,880 |
| 2016 | $856 | $21,000 | $6,120 | $14,880 |
| 2015 | $980 | $21,000 | $6,120 | $14,880 |
| 2014 | $1,216 | $28,200 | $8,240 | $19,960 |
Source: Public Records
Map
Nearby Homes
- 4445 Granada Dr
- 4050 Welcome All Terrace
- 4670 Kelden Cir
- 4090 Welcome All Terrace
- 4567 Parkway Cir
- 4157 Kenwood Trail
- 4544 Parkview Square
- 4658 Parkway Cir
- 4748 Highpoint Way
- 4191 Welcome All Terrace
- 4764 Highpoint Way Unit 131
- 4139 Kensington Cove
- 4603 Parkway Cir
- 4709 Tradition Pkwy
- 4437 Ben Hill Rd
- 200 Innesbrook Rd
- 4700 Welcome All Rd SW
- 00 Kelden Cir
- 4555 Kelden Cir Unit 2
- 3990 Will Lee Rd
- 4020 Will Lee Rd
- 4500 Granada Dr Unit 3
- 3980 Will Lee Rd
- 4490 Granada Dr Unit 3
- 4030 Will Lee Rd
- 4480 Granada Dr
- 3979 Will Lee Rd
- 4570 Kelden Cir
- 4040 Will Lee Rd
- 4015 Kelden Ct
- 3960 Will Lee Rd
- 4055 Will Lee Rd
- 4025 Kelden Ct
- 4580 Kelden Cir
- 4050 Will Lee Rd
- 4035 Kelden Ct
- 4495 Granada Dr