Estimated Value: $288,000 - $342,000
3
Beds
3
Baths
2,176
Sq Ft
$142/Sq Ft
Est. Value
About This Home
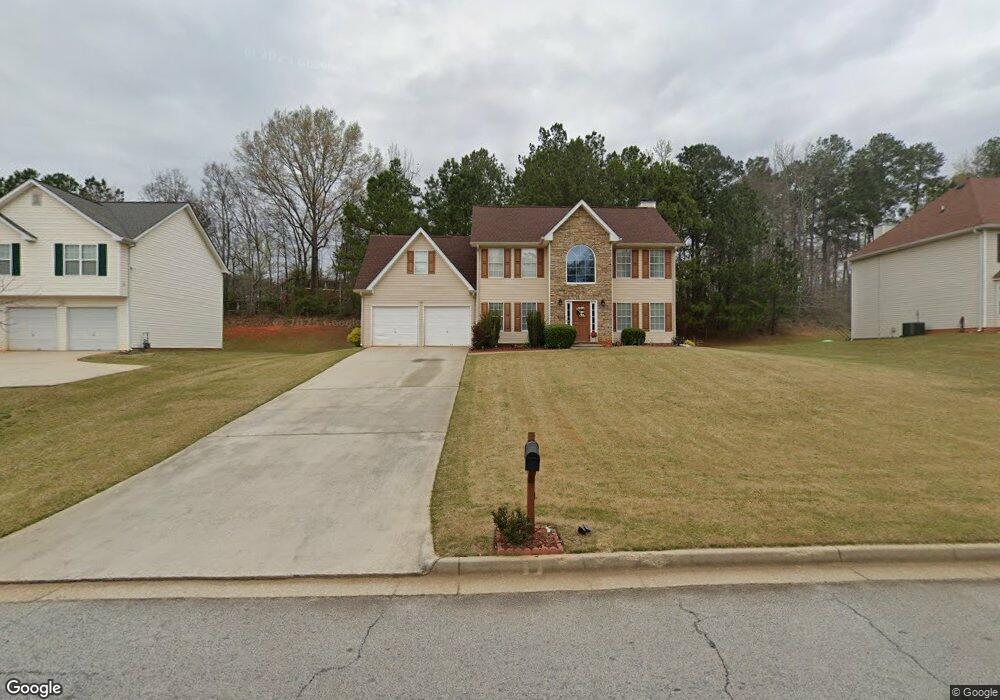
This home is located at 3988 Villager Way Unit 11, Rex, GA 30273 and is currently estimated at $308,480, approximately $141 per square foot. 3988 Villager Way Unit 11 is a home located in Clayton County with nearby schools including East Clayton Elementary School, Adamson Middle School, and Morrow High School.
Ownership History
Date
Name
Owned For
Owner Type
Purchase Details
Closed on
Jun 8, 2018
Sold by
Joseph Sheldon
Bought by
Chichester Tiffany K
Current Estimated Value
Home Financials for this Owner
Home Financials are based on the most recent Mortgage that was taken out on this home.
Original Mortgage
$154,156
Outstanding Balance
$135,484
Interest Rate
5.25%
Mortgage Type
FHA
Estimated Equity
$172,996
Purchase Details
Closed on
Feb 28, 2006
Sold by
Thompson Termaine V
Bought by
Joseph Sheldon
Home Financials for this Owner
Home Financials are based on the most recent Mortgage that was taken out on this home.
Original Mortgage
$155,000
Interest Rate
6.19%
Mortgage Type
New Conventional
Purchase Details
Closed on
Oct 1, 2001
Sold by
Ridgeland Homes Inc
Bought by
Thompson Termaine V
Home Financials for this Owner
Home Financials are based on the most recent Mortgage that was taken out on this home.
Original Mortgage
$140,050
Interest Rate
6.67%
Mortgage Type
FHA
Create a Home Valuation Report for This Property
The Home Valuation Report is an in-depth analysis detailing your home's value as well as a comparison with similar homes in the area
Home Values in the Area
Average Home Value in this Area
Purchase History
| Date | Buyer | Sale Price | Title Company |
|---|---|---|---|
| Chichester Tiffany K | $157,000 | -- | |
| Chichester Tiffany K | -- | -- | |
| Joseph Sheldon | $155,000 | -- | |
| Thompson Termaine V | $142,500 | -- |
Source: Public Records
Mortgage History
| Date | Status | Borrower | Loan Amount |
|---|---|---|---|
| Open | Chichester Tiffany K | $154,156 | |
| Closed | Chichester Tiffany K | $154,156 | |
| Previous Owner | Joseph Sheldon | $155,000 | |
| Previous Owner | Thompson Termaine V | $140,050 |
Source: Public Records
Tax History Compared to Growth
Tax History
| Year | Tax Paid | Tax Assessment Tax Assessment Total Assessment is a certain percentage of the fair market value that is determined by local assessors to be the total taxable value of land and additions on the property. | Land | Improvement |
|---|---|---|---|---|
| 2024 | $4,287 | $118,920 | $8,800 | $110,120 |
| 2023 | $2,555 | $97,720 | $8,800 | $88,920 |
| 2022 | $3,112 | $88,320 | $8,800 | $79,520 |
| 2021 | $2,348 | $68,480 | $8,800 | $59,680 |
| 2020 | $2,394 | $68,915 | $8,800 | $60,115 |
| 2019 | $2,105 | $60,915 | $5,600 | $55,315 |
| 2018 | $2,183 | $52,830 | $5,600 | $47,230 |
| 2017 | $1,926 | $46,387 | $5,600 | $40,787 |
| 2016 | $1,851 | $44,562 | $5,600 | $38,962 |
| 2015 | $1,821 | $0 | $0 | $0 |
| 2014 | $1,243 | $30,286 | $5,600 | $24,686 |
Source: Public Records
Map
Nearby Homes
- The Brookwood Plan at Legacy at Stagecoach
- The Northview Plan at Legacy at Stagecoach
- The Thorton Plan at Legacy at Stagecoach
- The Lancaster Plan at Legacy at Stagecoach
- The Chadwick Plan at Legacy at Stagecoach
- The Yorkshire Plan at Legacy at Stagecoach
- The Donovan Plan at Legacy at Stagecoach
- The Cheshire Plan at Legacy at Stagecoach
- 245 Remington Trail
- 4301 Rex Rd Unit I
- 20 Roundup Place
- 305 Belmont Farms Dr
- 3874 Rex Cir
- 5514 Frontier Ct
- 3821 Rex Mill Square
- 5847 Pinetree Ln
- 5550 Frontier Ct Unit 2
- 5284 Benjamin Trail
- 3614 Stagecoach Pass
- 5904 Foxfield Trail
- 3988 Villager Way Unit 164
- 3978 Villager Way Unit 11
- 3998 Villager Way
- 4010 Villager Way Unit 11
- 3968 Villager Way
- 3997 Peachtree Farms Rd Unit 10
- 4007 Peachtree Farms Rd Unit 10
- 3991 Villager Way Unit 11
- 3979 Villager Way Unit 11
- 4003 Villager Way
- 4003 Villager Way Unit 41D
- 4020 Villager Way
- 3958 Villager Way
- 3958 Villager Way Unit 161
- 4019 Peachtree Farms Rd Unit 10
- 3889 Fieldway Rd
- 3993 Peachtree Farms Rd
- 3967 Villager Way
- 4015 Villager Way
- 4015 Villager Way Unit 41C