Estimated Value: $192,000 - $276,000
3
Beds
2
Baths
1,204
Sq Ft
$195/Sq Ft
Est. Value
About This Home
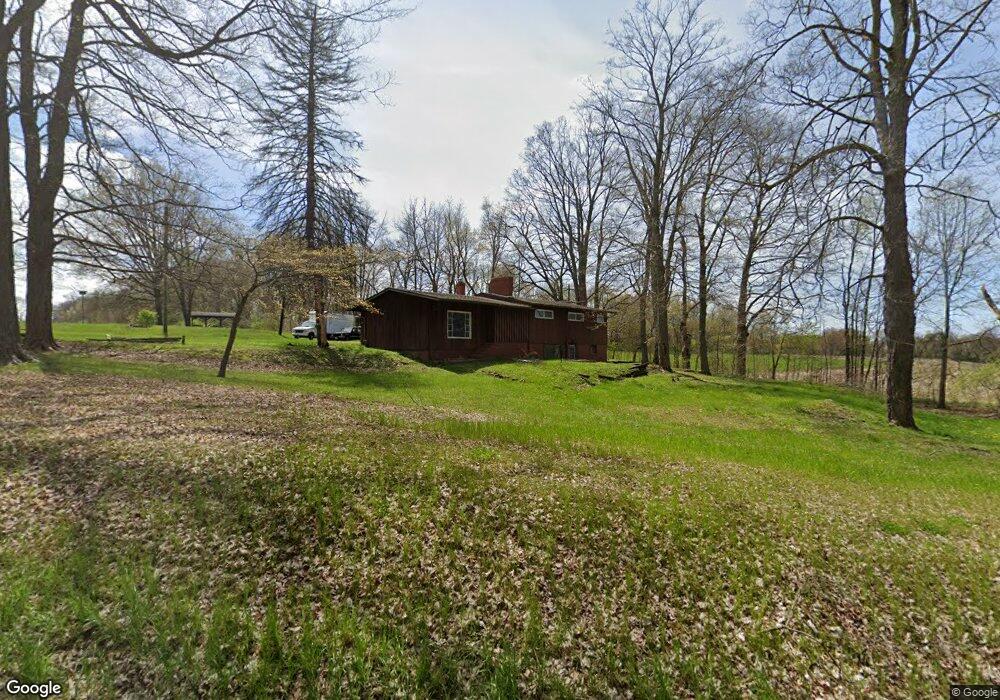
This home is located at 3989 Ranfield Rd, Kent, OH 44240 and is currently estimated at $234,363, approximately $194 per square foot. 3989 Ranfield Rd is a home located in Portage County with nearby schools including Brimfield Elementary School, Field Middle School, and Field High School.
Ownership History
Date
Name
Owned For
Owner Type
Purchase Details
Closed on
May 26, 2022
Sold by
Rodney Riggenbach
Bought by
Riggenbach Robert
Current Estimated Value
Purchase Details
Closed on
Aug 2, 2016
Sold by
Riggenbach Robert E and Riggenbach Yvonne B
Bought by
Riggenbach Robert E and Riggenbach Yvonne B
Purchase Details
Closed on
Dec 9, 2008
Sold by
Hsbc Bank Usa National Association
Bought by
Riggenbach Robert E and Riggenbach Yvonne B
Purchase Details
Closed on
Feb 4, 2008
Sold by
Thurston Juanita E and Case #2006Cv01622
Bought by
Wells Fargo Bank Na
Purchase Details
Closed on
Sep 9, 2002
Sold by
Sharpe Alva V and Sharpe David A
Bought by
Thurston Juanita E
Purchase Details
Closed on
Nov 3, 2000
Sold by
Sharpe Alva V
Bought by
Sharpe Alva V
Purchase Details
Closed on
Apr 26, 1990
Bought by
Sharpe Alva
Create a Home Valuation Report for This Property
The Home Valuation Report is an in-depth analysis detailing your home's value as well as a comparison with similar homes in the area
Home Values in the Area
Average Home Value in this Area
Purchase History
| Date | Buyer | Sale Price | Title Company |
|---|---|---|---|
| Riggenbach Robert | $125 | Simon William G | |
| Riggenbach Robert E | -- | None Available | |
| Riggenbach Robert E | $75,500 | Accutitle Agency Inc | |
| Hsbc Bank Usa National Association | -- | Accutitle Agency Inc | |
| Wells Fargo Bank Na | $90,000 | None Available | |
| Thurston Juanita E | $125,000 | Asta | |
| Sharpe Alva V | -- | -- | |
| White Harold | $6,000 | -- | |
| Sharpe Alva | -- | -- |
Source: Public Records
Tax History
| Year | Tax Paid | Tax Assessment Tax Assessment Total Assessment is a certain percentage of the fair market value that is determined by local assessors to be the total taxable value of land and additions on the property. | Land | Improvement |
|---|---|---|---|---|
| 2025 | $3,592 | $73,750 | $27,900 | $45,850 |
| 2024 | $3,533 | $73,750 | $27,900 | $45,850 |
| 2023 | $3,417 | $57,440 | $17,430 | $40,010 |
| 2022 | $3,469 | $57,440 | $17,430 | $40,010 |
| 2021 | $3,385 | $57,440 | $17,430 | $40,010 |
| 2020 | $3,087 | $47,290 | $17,430 | $29,860 |
| 2019 | $3,048 | $47,290 | $17,430 | $29,860 |
| 2018 | $2,443 | $44,630 | $17,430 | $27,200 |
| 2017 | $2,443 | $44,630 | $17,430 | $27,200 |
| 2016 | $2,437 | $44,630 | $17,430 | $27,200 |
| 2015 | $2,362 | $44,630 | $17,430 | $27,200 |
| 2014 | $2,281 | $44,630 | $17,430 | $27,200 |
| 2013 | $2,229 | $44,630 | $17,430 | $27,200 |
Source: Public Records
Map
Nearby Homes
- 4360 Beal Dr
- 4088 Lynwood Dr
- 3532 Gary Dr
- 3517 Jameson Dr
- 3910 Willow Way
- 3483 Lawndale Dr
- 3880 Selnik Rd
- 3890 Grace Dr
- 2477 Waterford Pointe Dr
- 3929 Lor Ron St
- 4545 State Route 43
- 1680 Countryview Dr
- 1676 Countryview Dr
- 4184 Hunters Ridge Dr
- 2092 Sugar Maple Dr
- 5088 Spruce Knoll Run
- 4620 Briar Hill Dr
- 4700 Gooseberry Knoll
- 0 Meloy Rd Unit 5162435
- 1997 Sugar Maple Dr
- V/L Ranfield Rd
- 3975 Ranfield Rd
- 3924 Ranfield Rd
- 4002 Ranfield Rd
- 3969 Ranfield Rd
- 3963 Ranfield Rd
- 3957 Ranfield Rd
- 3895 Morley Dr
- 1512 Tallmadge Rd
- 4036 Ranfield Rd
- 3947 Morley Dr
- 3899 Morley Dr
- 3893 Morley Dr
- 1494 Tallmadge Rd
- 3891 Morley Dr
- 1472 Tallmadge Rd
- 1542 Tallmadge Rd
- 3887 Morley Dr
- 3933 Morley Dr
- 3898 Morley Dr
Your Personal Tour Guide
Ask me questions while you tour the home.