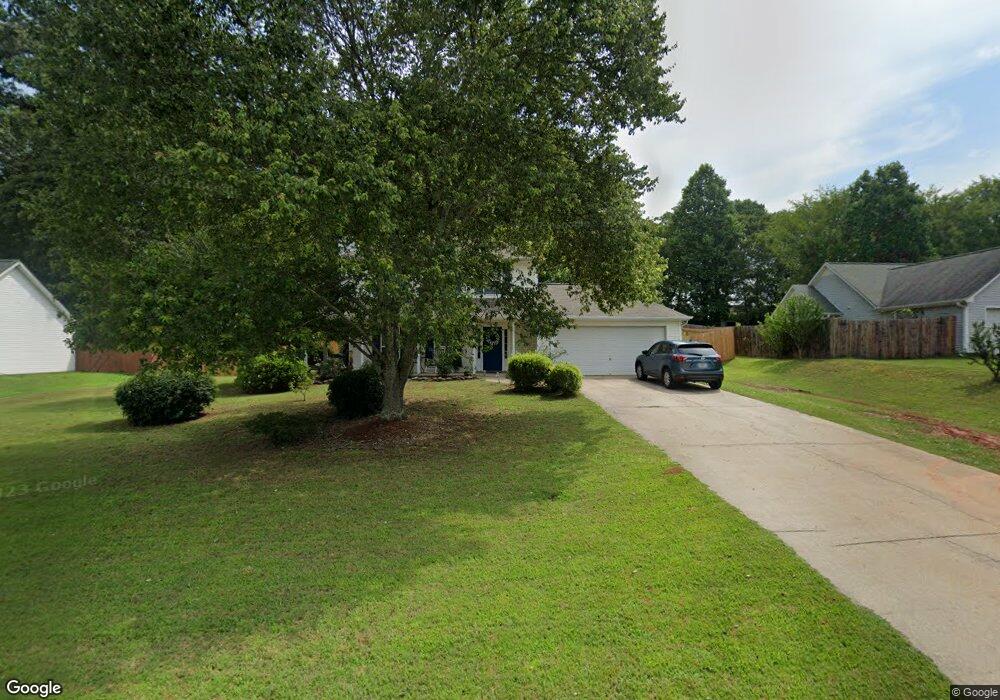
399 Arrowhatchee Dr Unit 1 Winder, GA 30680
Estimated Value: $317,000 - $352,000
--
Bed
3
Baths
1,588
Sq Ft
$208/Sq Ft
Est. Value
About This Home
This home is located at 399 Arrowhatchee Dr Unit 1, Winder, GA 30680 and is currently estimated at $330,405, approximately $208 per square foot. 399 Arrowhatchee Dr Unit 1 is a home located in Barrow County with nearby schools including Holsenbeck Elementary School, Bear Creek Middle School, and Winder-Barrow High School.
Ownership History
Date
Name
Owned For
Owner Type
Purchase Details
Closed on
Jan 27, 2003
Sold by
Lam Marla L
Bought by
Lam Ralph R
Current Estimated Value
Home Financials for this Owner
Home Financials are based on the most recent Mortgage that was taken out on this home.
Original Mortgage
$108,000
Outstanding Balance
$46,254
Interest Rate
5.95%
Mortgage Type
Stand Alone Refi Refinance Of Original Loan
Estimated Equity
$284,151
Purchase Details
Closed on
Nov 21, 2001
Sold by
Custom Quality Homes
Bought by
Lam Maria
Home Financials for this Owner
Home Financials are based on the most recent Mortgage that was taken out on this home.
Original Mortgage
$106,100
Interest Rate
6.54%
Mortgage Type
New Conventional
Purchase Details
Closed on
Jan 30, 2001
Sold by
Hkb Inc
Bought by
Custom Quality Homes
Purchase Details
Closed on
Apr 29, 1999
Bought by
Hkb Inc
Create a Home Valuation Report for This Property
The Home Valuation Report is an in-depth analysis detailing your home's value as well as a comparison with similar homes in the area
Home Values in the Area
Average Home Value in this Area
Purchase History
| Date | Buyer | Sale Price | Title Company |
|---|---|---|---|
| Lam Ralph R | -- | -- | |
| Lam Maria | $117,900 | -- | |
| Custom Quality Homes | $26,900 | -- | |
| Hkb Inc | -- | -- |
Source: Public Records
Mortgage History
| Date | Status | Borrower | Loan Amount |
|---|---|---|---|
| Open | Lam Ralph R | $108,000 | |
| Previous Owner | Lam Maria | $106,100 |
Source: Public Records
Tax History Compared to Growth
Tax History
| Year | Tax Paid | Tax Assessment Tax Assessment Total Assessment is a certain percentage of the fair market value that is determined by local assessors to be the total taxable value of land and additions on the property. | Land | Improvement |
|---|---|---|---|---|
| 2024 | $2,045 | $90,678 | $24,000 | $66,678 |
| 2023 | $1,625 | $90,678 | $24,000 | $66,678 |
| 2022 | $2,047 | $78,138 | $24,000 | $54,138 |
| 2021 | $1,953 | $70,138 | $16,000 | $54,138 |
| 2020 | $1,681 | $58,542 | $14,000 | $44,542 |
| 2019 | $1,706 | $58,542 | $14,000 | $44,542 |
| 2018 | $1,581 | $54,223 | $11,600 | $42,623 |
| 2017 | $1,304 | $44,776 | $11,600 | $33,176 |
| 2016 | $1,204 | $41,996 | $11,600 | $30,396 |
| 2015 | $1,209 | $41,996 | $11,600 | $30,396 |
| 2014 | -- | $37,302 | $6,566 | $30,736 |
| 2013 | -- | $37,331 | $6,566 | $30,765 |
Source: Public Records
Map
Nearby Homes
- 397 Arrowhatchee Dr Unit 1
- 395 Arrowhatchee Dr
- 403 Arrowhatchee Dr
- 570 570 Stratford Pkwy
- 570 Stratford Pkwy
- 400 Arrowhatchee Dr Unit 1
- 393 Arrowhatchee Dr Unit 1
- 405 Arrowhatchee Dr
- 405 Arrowhatchee Dr Unit 1
- 398 Arrowhatchee Dr
- 402 Arrowhatchee Dr Unit 1
- 574 Stratford Pkwy
- 564 Stratford Pkwy
- 568 Stratford Pkwy
- 394 Arrowhatchee Dr
- 566 Stratford Pkwy
- 407 Arrowhatchee Dr
- 391 Arrowhatchee Dr Unit 1
- 391 Arrowhatchee Dr
- 406 Arrowhatchee Dr Unit 1