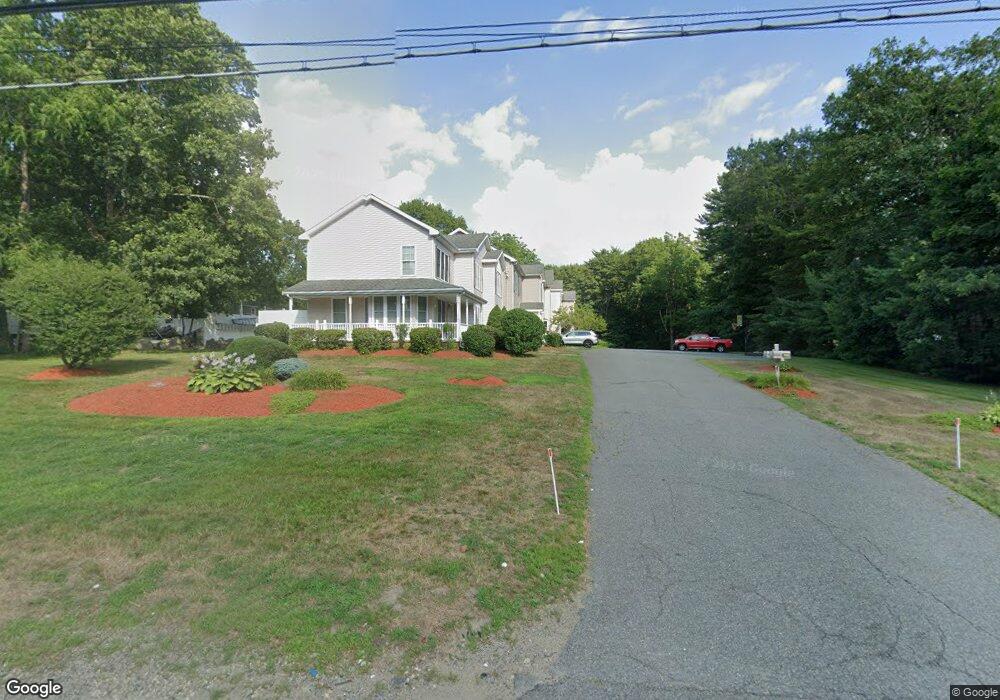
399 Pleasant St Unit 2 Stoughton, MA 02072
Estimated Value: $131,000 - $568,372
3
Beds
3
Baths
1,754
Sq Ft
$246/Sq Ft
Est. Value
About This Home
This home is located at 399 Pleasant St Unit 2, Stoughton, MA 02072 and is currently estimated at $431,843, approximately $246 per square foot. 399 Pleasant St Unit 2 is a home located in Norfolk County with nearby schools including Joseph R Dawe Jr Elementary School, Dr. Robert G. O'Donnell Middle School, and Stoughton High School.
Ownership History
Date
Name
Owned For
Owner Type
Purchase Details
Closed on
Aug 27, 2025
Sold by
Vital Pierre
Bought by
Feliciano-Vital Sandra
Current Estimated Value
Purchase Details
Closed on
Aug 20, 2020
Sold by
Noievaisa T T and Noievaisa N
Bought by
Feliciano-Vital Sandra and Vital Pierre
Home Financials for this Owner
Home Financials are based on the most recent Mortgage that was taken out on this home.
Original Mortgage
$330,000
Interest Rate
2.9%
Mortgage Type
New Conventional
Purchase Details
Closed on
Nov 6, 2017
Sold by
Norvaisa Sarunas J and Norvaisa Asta J
Bought by
Norvaisa T T and Norvaisa N
Purchase Details
Closed on
Oct 11, 2012
Sold by
Cannon Sheila N
Bought by
Norvaisa Asta J and Norvaisa Sarunas J
Purchase Details
Closed on
Jun 14, 2007
Sold by
Tlc Stones Llc
Bought by
Cannon Sheila N
Home Financials for this Owner
Home Financials are based on the most recent Mortgage that was taken out on this home.
Original Mortgage
$319,900
Interest Rate
6.19%
Mortgage Type
Purchase Money Mortgage
Create a Home Valuation Report for This Property
The Home Valuation Report is an in-depth analysis detailing your home's value as well as a comparison with similar homes in the area
Home Values in the Area
Average Home Value in this Area
Purchase History
| Date | Buyer | Sale Price | Title Company |
|---|---|---|---|
| Feliciano-Vital Sandra | $100,000 | -- | |
| Feliciano-Vital Sandra | $432,000 | None Available | |
| Feliciano-Vital Sandra | $432,000 | None Available | |
| Norvaisa T T | -- | -- | |
| Norvaisa T T | -- | -- | |
| Norvaisa Asta J | $248,000 | -- | |
| Norvaisa Asta J | $248,000 | -- | |
| Norvaisa Asta J | $248,000 | -- | |
| Cannon Sheila N | $399,900 | -- | |
| Cannon Sheila N | $399,900 | -- | |
| Cannon Sheila N | $399,900 | -- |
Source: Public Records
Mortgage History
| Date | Status | Borrower | Loan Amount |
|---|---|---|---|
| Previous Owner | Feliciano-Vital Sandra | $330,000 | |
| Previous Owner | Cannon Sheila N | $319,900 |
Source: Public Records
Tax History Compared to Growth
Tax History
| Year | Tax Paid | Tax Assessment Tax Assessment Total Assessment is a certain percentage of the fair market value that is determined by local assessors to be the total taxable value of land and additions on the property. | Land | Improvement |
|---|---|---|---|---|
| 2025 | $6,289 | $508,000 | $0 | $508,000 |
| 2024 | $6,193 | $486,500 | $0 | $486,500 |
| 2023 | $6,115 | $451,300 | $0 | $451,300 |
| 2022 | $6,008 | $416,900 | $0 | $416,900 |
| 2021 | $5,323 | $352,500 | $0 | $352,500 |
| 2020 | $5,249 | $352,500 | $0 | $352,500 |
| 2019 | $4,818 | $314,100 | $0 | $314,100 |
| 2018 | $4,430 | $299,100 | $0 | $299,100 |
| 2017 | $3,696 | $255,100 | $0 | $255,100 |
| 2016 | $4,096 | $273,600 | $0 | $273,600 |
| 2015 | $3,984 | $263,300 | $0 | $263,300 |
| 2014 | $3,870 | $245,900 | $0 | $245,900 |
Source: Public Records
Map
Nearby Homes
- 399 Pleasant St Unit D
- 399 Pleasant St Unit 4
- 399 Pleasant St Unit 3
- 399 Pleasant St Unit 1
- 399 Pleasant St Unit A
- 399 Pleasant St Unit B
- 399 Pleasant St Unit C
- 399 Pleasant St
- 409 Pleasant St
- 387 Pleasant St
- 14 Richard Rd
- 26 Richard Rd Unit 1
- 379 Pleasant St
- 30 Richard Rd
- 386 Pleasant St
- 32 Richard Rd Unit 32
- 402 Pleasant St
- 402 Pleasant St Unit 402
- 392 Pleasant St
- 688 Central St