
Seller's Agent in 2025
Larry Hines
RE/MAX
(847) 875-7747
1 in this area
85 Total Sales
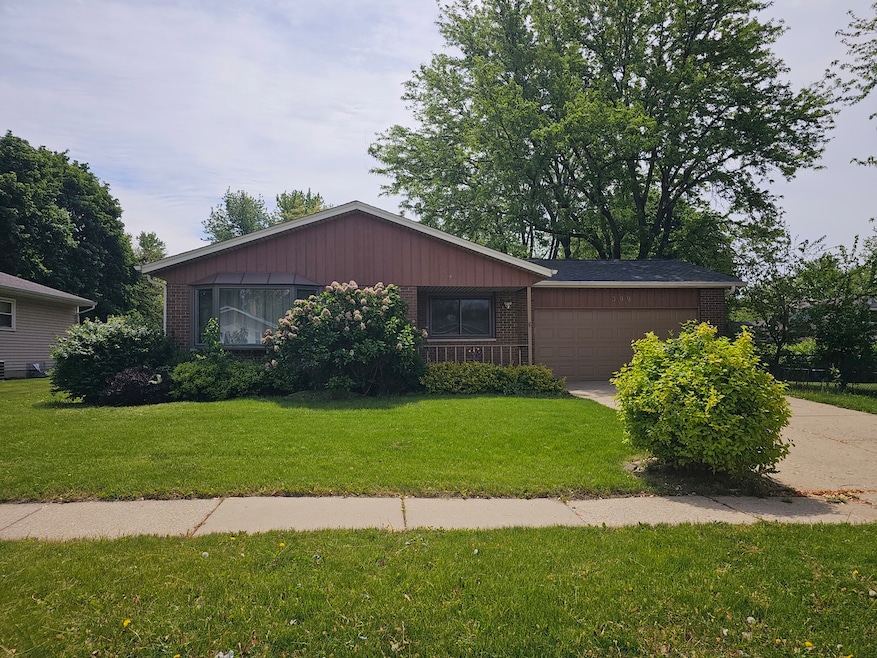
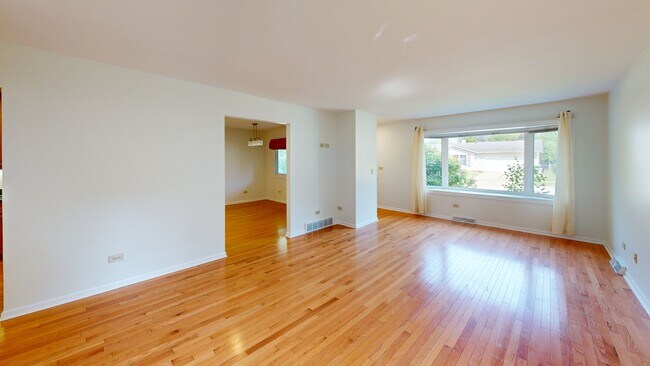

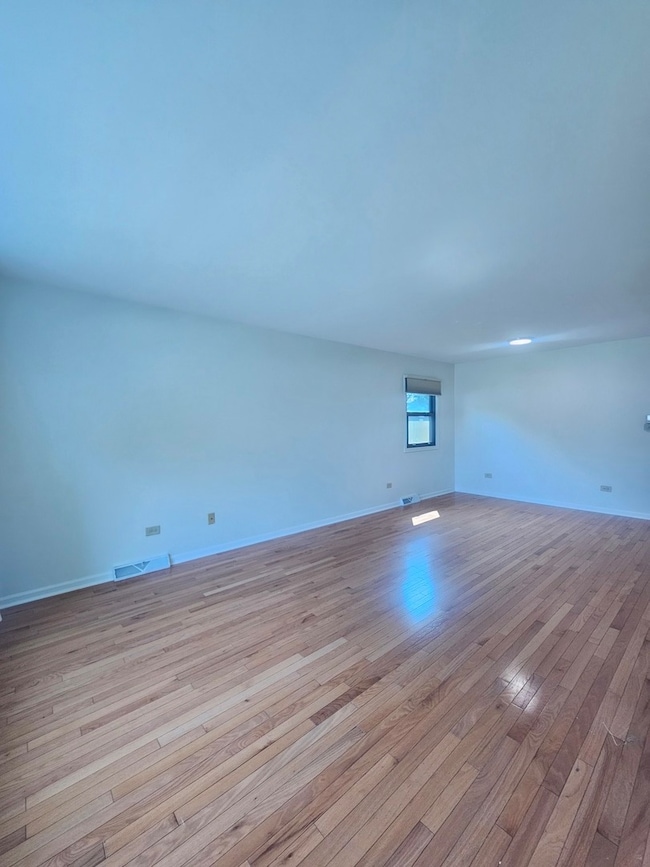
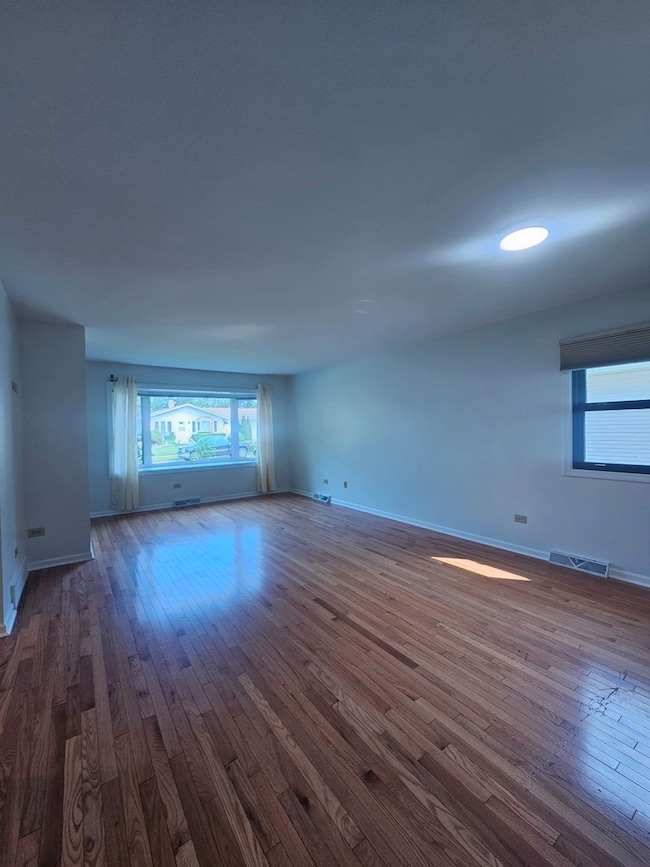
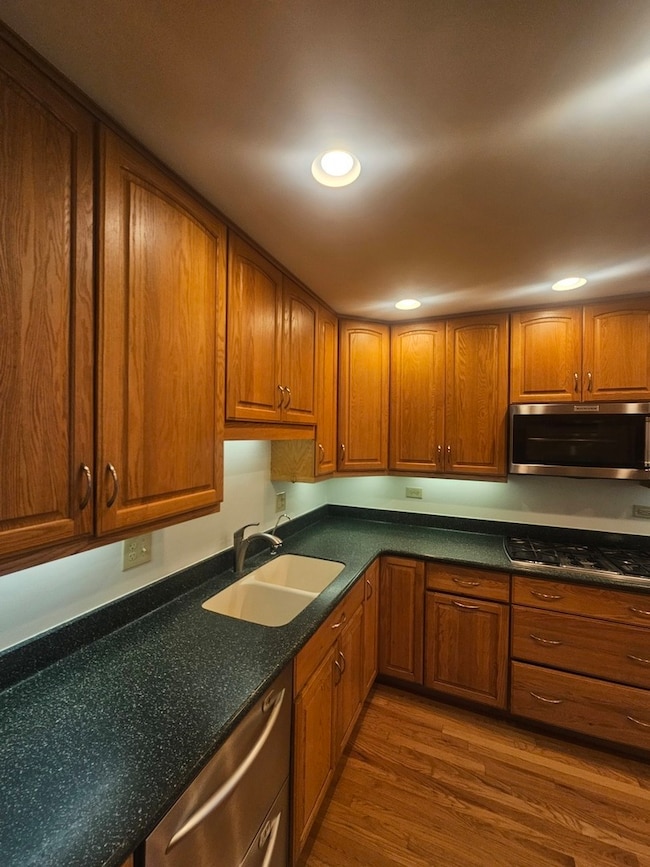
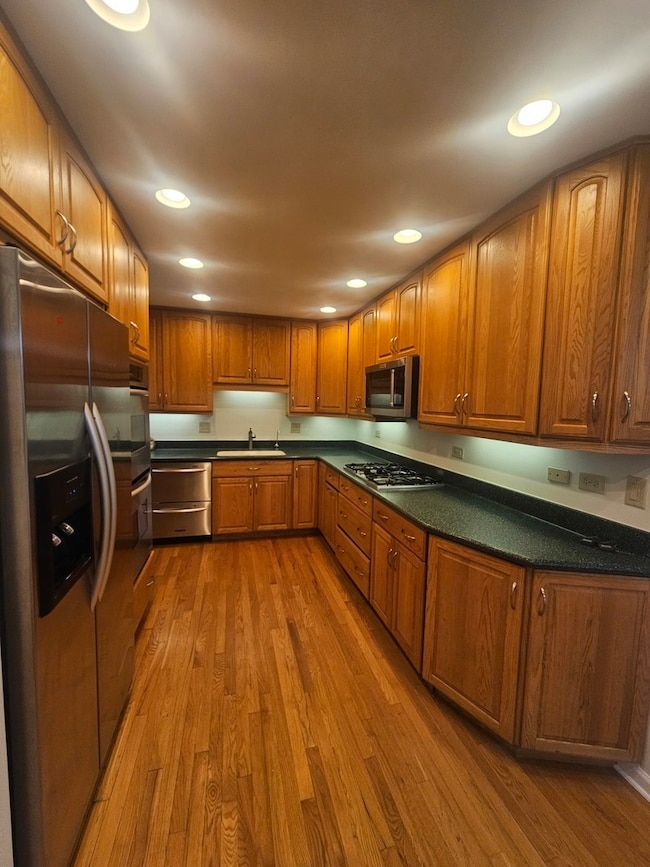
Sharp and ready 3 bedroom ranch with Great finished basement offering Huge family/rec room, Den 3rd full bath, Big backyard with patio, ready now
Last Buyer's Agent
Patricia Briones
eXp Realty License #475202215
| Date | Type | Sale Price | Title Company |
|---|---|---|---|
| Warranty Deed | $375,000 | None Listed On Document | |
| Deed | $220,000 | Fidelity National Title | |
| Interfamily Deed Transfer | -- | None Available | |
| Joint Tenancy Deed | -- | -- |
| Date | Status | Loan Amount | Loan Type |
|---|---|---|---|
| Open | $337,500 | New Conventional | |
| Previous Owner | $165,000 | New Conventional |
| Date | Event | Price | List to Sale | Price per Sq Ft |
|---|---|---|---|---|
| 07/25/2025 07/25/25 | Sold | $375,000 | 0.0% | $303 / Sq Ft |
| 06/12/2025 06/12/25 | Pending | -- | -- | -- |
| 06/09/2025 06/09/25 | For Sale | $375,000 | -- | $303 / Sq Ft |
| Year | Tax Paid | Tax Assessment Tax Assessment Total Assessment is a certain percentage of the fair market value that is determined by local assessors to be the total taxable value of land and additions on the property. | Land | Improvement |
|---|---|---|---|---|
| 2024 | $6,773 | $84,637 | $21,363 | $63,274 |
| 2023 | $6,518 | $76,463 | $19,300 | $57,163 |
| 2022 | $6,046 | $69,721 | $17,598 | $52,123 |
| 2021 | $4,834 | $65,184 | $16,453 | $48,731 |
| 2020 | $4,672 | $62,228 | $15,707 | $46,521 |
| 2019 | $4,509 | $59,276 | $14,962 | $44,314 |
| 2018 | $4,218 | $53,660 | $14,095 | $39,565 |
| 2017 | $4,086 | $50,728 | $13,325 | $37,403 |
| 2016 | $3,846 | $47,062 | $12,362 | $34,700 |
| 2015 | -- | $43,137 | $11,331 | $31,806 |
| 2014 | -- | $42,604 | $11,191 | $31,413 |
| 2013 | -- | $43,728 | $11,486 | $32,242 |
Seller's Agent in 2025
Larry Hines
RE/MAX
(847) 875-7747
1 in this area
85 Total Sales
P
Buyer's Agent in 2025
Patricia Briones
eXp Realty
Source: Midwest Real Estate Data (MRED)
MLS Number: 12387571
APN: 06-21-259-007
Disclaimer: Certain information contained herein is derived from information provided by parties other than Homes.com. All information provided is deemed reliable, but is not guaranteed to be accurate and should be independently verified.
![]() Based on information submitted to the MLS GRID. All data is obtained from various sources and may not have been verified by broker or MLS GRID. Supplied Open House Information is subject to change without notice. All information should be independently reviewed and verified for accuracy. Properties may or may not be listed by the office/agent presenting the information. Some IDX listings have been excluded from this website.
Based on information submitted to the MLS GRID. All data is obtained from various sources and may not have been verified by broker or MLS GRID. Supplied Open House Information is subject to change without notice. All information should be independently reviewed and verified for accuracy. Properties may or may not be listed by the office/agent presenting the information. Some IDX listings have been excluded from this website.
Based on information submitted to the MLS GRID
Ask me questions while you tour the home.