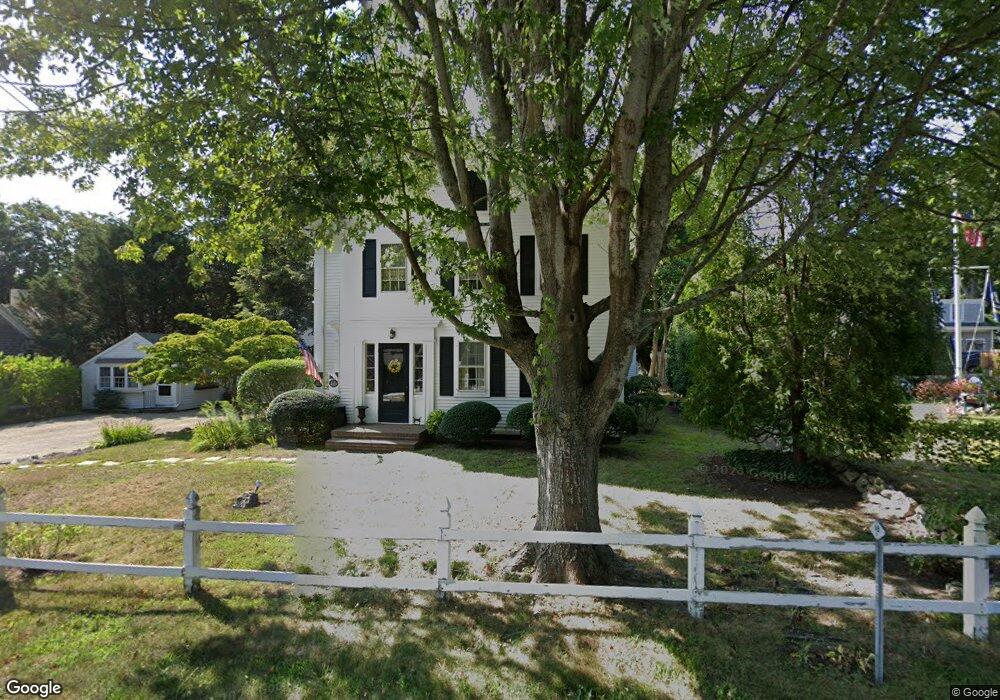
399 Route 6a Yarmouth Port, MA 02675
Yarmouth Port NeighborhoodEstimated Value: $1,143,712 - $1,657,000
4
Beds
5
Baths
400
Sq Ft
$3,460/Sq Ft
Est. Value
About This Home
This home is located at 399 Route 6a, Yarmouth Port, MA 02675 and is currently estimated at $1,383,928, approximately $3,459 per square foot. 399 Route 6a is a home located in Barnstable County with nearby schools including Dennis-Yarmouth Regional High School, Trinity Christian Academy of Cape Cod, and St. Pius X. School.
Ownership History
Date
Name
Owned For
Owner Type
Purchase Details
Closed on
Oct 8, 2004
Sold by
Smith Kenneth P and Leanza Laura L
Bought by
Chaffee Elizabeth Jean
Current Estimated Value
Home Financials for this Owner
Home Financials are based on the most recent Mortgage that was taken out on this home.
Original Mortgage
$686,439
Outstanding Balance
$341,553
Interest Rate
5.84%
Mortgage Type
Purchase Money Mortgage
Estimated Equity
$1,042,375
Create a Home Valuation Report for This Property
The Home Valuation Report is an in-depth analysis detailing your home's value as well as a comparison with similar homes in the area
Home Values in the Area
Average Home Value in this Area
Purchase History
| Date | Buyer | Sale Price | Title Company |
|---|---|---|---|
| Chaffee Elizabeth Jean | $706,939 | -- |
Source: Public Records
Mortgage History
| Date | Status | Borrower | Loan Amount |
|---|---|---|---|
| Open | Chaffee Elizabeth Jean | $686,439 |
Source: Public Records
Tax History Compared to Growth
Tax History
| Year | Tax Paid | Tax Assessment Tax Assessment Total Assessment is a certain percentage of the fair market value that is determined by local assessors to be the total taxable value of land and additions on the property. | Land | Improvement |
|---|---|---|---|---|
| 2025 | $6,364 | $898,800 | $247,900 | $650,900 |
| 2024 | $5,917 | $801,800 | $215,700 | $586,100 |
| 2023 | $6,229 | $768,100 | $182,000 | $586,100 |
| 2022 | $5,905 | $643,200 | $162,900 | $480,300 |
| 2021 | $5,334 | $557,900 | $162,900 | $395,000 |
| 2020 | $6,065 | $606,500 | $160,300 | $446,200 |
| 2019 | $5,652 | $606,500 | $160,300 | $446,200 |
| 2018 | $6,144 | $597,100 | $150,900 | $446,200 |
| 2017 | $5,983 | $597,100 | $150,900 | $446,200 |
| 2016 | $5,959 | $597,100 | $150,900 | $446,200 |
| 2015 | $6,560 | $653,400 | $150,900 | $502,500 |
Source: Public Records
Map
Nearby Homes