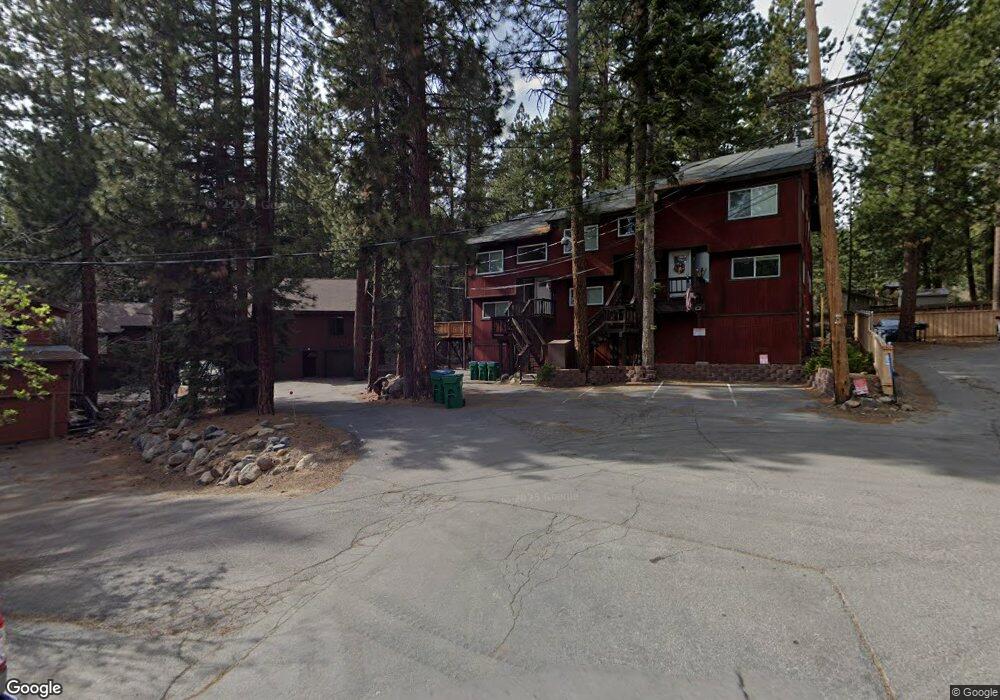
399 Willow Ct Incline Village, NV 89451
Estimated Value: $671,000 - $837,000
2
Beds
2
Baths
1,332
Sq Ft
$569/Sq Ft
Est. Value
About This Home
This home is located at 399 Willow Ct, Incline Village, NV 89451 and is currently estimated at $757,791, approximately $568 per square foot. 399 Willow Ct is a home located in Washoe County with nearby schools including Incline Elementary School, Incline Middle School, and Incline High School.
Ownership History
Date
Name
Owned For
Owner Type
Purchase Details
Closed on
Sep 19, 2019
Sold by
Lei Ming
Bought by
Witt Steven G and Witt Fmtr Ann
Current Estimated Value
Purchase Details
Closed on
Jan 15, 2013
Sold by
Li Xiaolan
Bought by
Lei Ming
Purchase Details
Closed on
Jan 14, 2013
Sold by
Aynesmith Lawrence
Bought by
Lei Ming
Purchase Details
Closed on
Nov 29, 2001
Sold by
Morris Mark W and Morris Anne C
Bought by
Aynesmith Lawrence
Home Financials for this Owner
Home Financials are based on the most recent Mortgage that was taken out on this home.
Original Mortgage
$180,000
Interest Rate
6.63%
Mortgage Type
Balloon
Purchase Details
Closed on
Dec 17, 1993
Sold by
Morris Mark W
Bought by
Morris Mark W and Morris Anne C
Create a Home Valuation Report for This Property
The Home Valuation Report is an in-depth analysis detailing your home's value as well as a comparison with similar homes in the area
Home Values in the Area
Average Home Value in this Area
Purchase History
| Date | Buyer | Sale Price | Title Company |
|---|---|---|---|
| Witt Steven G | $425,000 | First American Title Iv | |
| Lei Ming | -- | First American Title Iv | |
| Lei Ming | $120,000 | First American Title Iv | |
| Aynesmith Lawrence | $225,000 | Founders Title Co | |
| Morris Mark W | -- | -- | |
| Morris Mark W | -- | -- |
Source: Public Records
Mortgage History
| Date | Status | Borrower | Loan Amount |
|---|---|---|---|
| Previous Owner | Aynesmith Lawrence | $180,000 | |
| Closed | Aynesmith Lawrence | $22,500 |
Source: Public Records
Tax History Compared to Growth
Tax History
| Year | Tax Paid | Tax Assessment Tax Assessment Total Assessment is a certain percentage of the fair market value that is determined by local assessors to be the total taxable value of land and additions on the property. | Land | Improvement |
|---|---|---|---|---|
| 2025 | $2,156 | $96,401 | $65,485 | $30,916 |
| 2024 | $2,156 | $90,750 | $58,170 | $32,580 |
| 2023 | $2,112 | $84,679 | $55,405 | $29,274 |
| 2022 | $2,389 | $73,058 | $45,850 | $27,208 |
| 2021 | $2,342 | $55,969 | $28,665 | $27,304 |
| 2020 | $2,345 | $58,566 | $30,975 | $27,591 |
| 2019 | $2,301 | $53,533 | $26,215 | $27,318 |
| 2018 | $2,233 | $43,825 | $16,975 | $26,850 |
| 2017 | $2,177 | $43,302 | $16,485 | $26,817 |
| 2016 | $2,143 | $43,493 | $16,205 | $27,288 |
| 2015 | $2,140 | $37,895 | $11,725 | $26,170 |
| 2014 | $2,119 | $38,723 | $11,725 | $26,998 |
| 2013 | -- | $36,367 | $9,800 | $26,567 |
Source: Public Records
Map
Nearby Homes
- 839 McCourry Blvd
- 801 Northwood Blvd Unit 17
- 801 Northwood Blvd Unit 20
- 810 Alder Ave Unit 61
- 810 Alder Ave Unit 64
- 810 Alder Ave Unit 71
- 347 Cottonwood Ct
- 424 Pat Ct
- 807 Alder Ave Unit 89
- 807 Alder Ave Unit 44
- 807 Alder Ave Unit 82
- 807 Alder Ave Unit 61
- 807 Alder Ave Unit 10
- 807 Alder Ave Unit 90
- 807 Alder Ave Unit 49
- 363 Winding Way
- 866 Northwood Blvd Unit 6
- 866 Northwood Blvd Unit 32
- 751 Tahoe Blvd Unit 20
- 830 Oriole Way Unit 7
- 399 Willow Ct
- 399 Willow Ct
- 399 Willow Ct Unit 1
- 399 Willow Ct Unit 2
- 399 Willow Ct Unit 3
- 399 Willow Ct
- 383 Willow Ct
- 383 Willow Ct Unit 2
- 383 Willow Ct
- 383 Willow Ct Unit 4
- 383 Willow Ct Unit 3
- 383 Willow Ct Unit 3
- 398 Willow Ct
- 398 Willow Ct
- 472 Winding Way
- 382 Willow Ct
- 391 Willow Ct Unit 3
- 391 Willow Ct
- 391 Willow Ct Unit 1
- 391 Willow Ct Unit 4