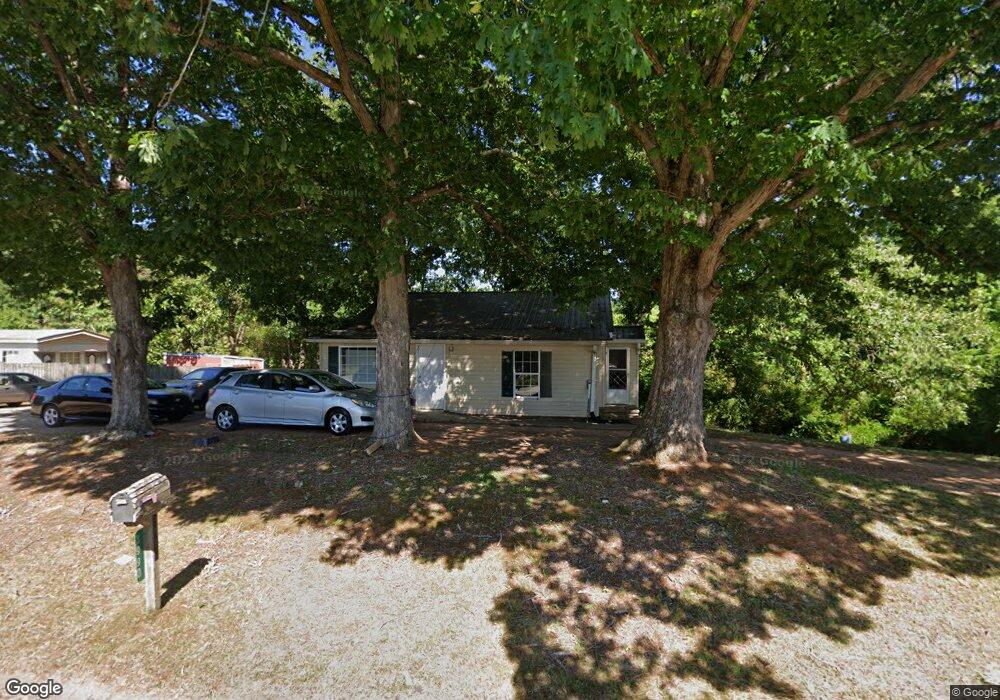
3990 Dicks Hill Pkwy Mount Airy, GA 30563
Estimated Value: $249,109 - $299,000
4
Beds
1
Bath
3,142
Sq Ft
$86/Sq Ft
Est. Value
About This Home
This home is located at 3990 Dicks Hill Pkwy, Mount Airy, GA 30563 and is currently estimated at $269,027, approximately $85 per square foot. 3990 Dicks Hill Pkwy is a home located in Habersham County with nearby schools including Hazel Grove Elementary School, Habersham Success Academy, and North Habersham Middle School.
Ownership History
Date
Name
Owned For
Owner Type
Purchase Details
Closed on
Oct 4, 2018
Sold by
Martin-Martin Jorge
Bought by
Martin-Martin Jorge and Pascual Maria Jose
Current Estimated Value
Home Financials for this Owner
Home Financials are based on the most recent Mortgage that was taken out on this home.
Original Mortgage
$87,403
Outstanding Balance
$77,942
Interest Rate
5.62%
Mortgage Type
FHA
Estimated Equity
$191,085
Purchase Details
Closed on
Oct 3, 2018
Sold by
Libby Sandra L
Bought by
Martin-Martin Jorge
Home Financials for this Owner
Home Financials are based on the most recent Mortgage that was taken out on this home.
Original Mortgage
$87,403
Outstanding Balance
$77,942
Interest Rate
5.62%
Mortgage Type
FHA
Estimated Equity
$191,085
Purchase Details
Closed on
Apr 12, 2011
Sold by
Branch Banking
Bought by
Libby Sandra L
Purchase Details
Closed on
Jan 20, 2010
Sold by
Mcelreath Michael S
Bought by
Branch Banking
Create a Home Valuation Report for This Property
The Home Valuation Report is an in-depth analysis detailing your home's value as well as a comparison with similar homes in the area
Home Values in the Area
Average Home Value in this Area
Purchase History
| Date | Buyer | Sale Price | Title Company |
|---|---|---|---|
| Martin-Martin Jorge | -- | -- | |
| Martin-Martin Jorge | $95,900 | -- | |
| Libby Sandra L | $39,500 | -- | |
| Branch Banking | $55,250 | -- |
Source: Public Records
Mortgage History
| Date | Status | Borrower | Loan Amount |
|---|---|---|---|
| Open | Martin-Martin Jorge | $87,403 | |
| Closed | Martin-Martin Jorge | $87,403 |
Source: Public Records
Tax History Compared to Growth
Tax History
| Year | Tax Paid | Tax Assessment Tax Assessment Total Assessment is a certain percentage of the fair market value that is determined by local assessors to be the total taxable value of land and additions on the property. | Land | Improvement |
|---|---|---|---|---|
| 2025 | $2,116 | $87,604 | $18,189 | $69,415 |
| 2024 | $1,819 | $70,080 | $17,644 | $52,436 |
| 2023 | $1,331 | $53,220 | $9,500 | $43,720 |
| 2022 | $1,198 | $45,944 | $8,144 | $37,800 |
| 2021 | $1,064 | $40,992 | $6,788 | $34,204 |
| 2020 | $979 | $36,388 | $6,788 | $29,600 |
| 2019 | $980 | $36,388 | $6,788 | $29,600 |
| 2018 | $592 | $22,180 | $2,900 | $19,280 |
| 2017 | $422 | $15,732 | $2,900 | $12,832 |
| 2016 | $410 | $39,330 | $2,900 | $12,832 |
| 2015 | -- | $39,330 | $2,900 | $12,832 |
| 2014 | $415 | $39,500 | $2,844 | $12,956 |
| 2013 | -- | $15,800 | $2,844 | $12,956 |
Source: Public Records
Map
Nearby Homes
- 120 Beck Rd
- 110 Waterloo Dr
- 199 Rocky Shoals Trail
- 408 Twinflower Dr
- 209 Hazel Creek Rd
- 203 Russell Woods Dr
- 0 N Highway 365 Unit 10006830
- 0 Blair Rd Unit 10343806
- 278 Oakwood Place
- 309 Morning Star Ln
- 166 Towerview Cir
- 432 Nancy Town Rd
- 380 Nancy Town Rd
- 2240 Hazel Creek Rd
- 339 Ben Loudermilk Rd
- 310 Wilson Rd
- 161 Wayward Winds Dr
- 204 Linwood Dr
- 787 Ansley Rd
- 1605 Cody Rd
- 4000 Dicks Hill Pkwy
- 3788 Dicks Hill Pkwy
- 3923 Dicks Hill Pkwy
- 4010 Dicks Hill Pkwy
- 3909 Dicks Hill Pkwy
- 110 Renegade Trail
- 0 Renegade Trail
- 4060 Dicks Hill Pkwy
- 269 Francis Hefner Rd
- 3783 Dicks Hill Pkwy
- 201 Francis Hefner Rd
- 1702 Welcome Home Rd
- 200 Renegade Trail
- 3725 Dicks Hill Pkwy
- 1646 Welcome Home Rd
- 3699 Dicks Hill Pkwy
- 3699 Dicks Hill Pkwy
- 4040 Dicks Hill Pkwy
- 4040 Dicks Hill Pkwy
- 1524 Welcome Home Rd