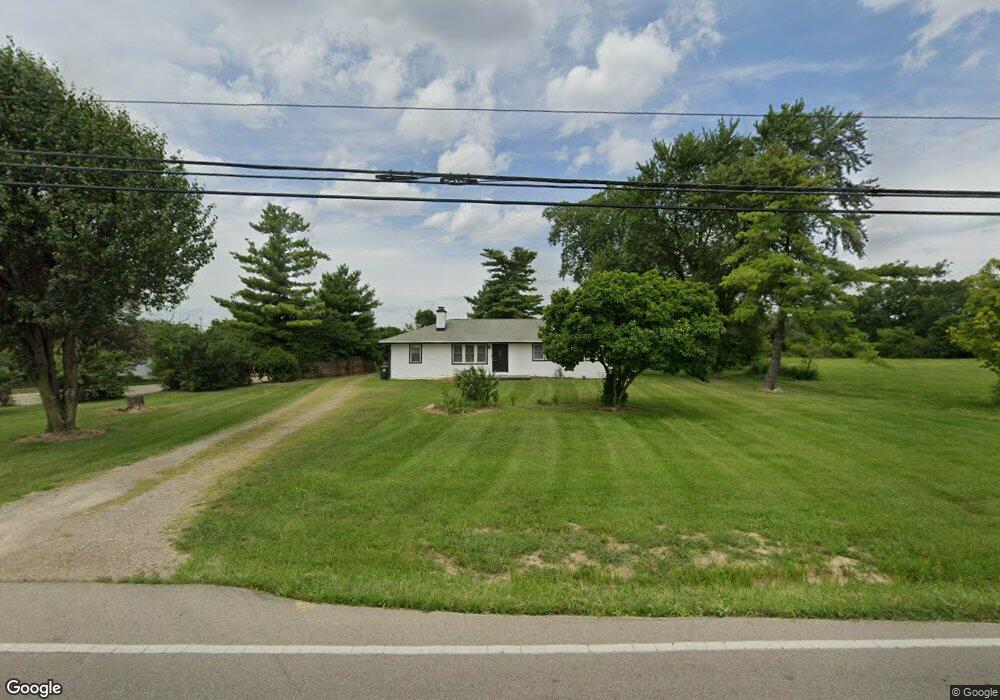
3991 Benner Rd Miamisburg, OH 45342
Estimated Value: $72,000
3
Beds
1
Bath
1,107
Sq Ft
$65/Sq Ft
Est. Value
About This Home
This home is located at 3991 Benner Rd, Miamisburg, OH 45342 and is currently estimated at $72,000, approximately $65 per square foot. 3991 Benner Rd is a home located in Montgomery County with nearby schools including Miamisburg High School and Bishop Leibold School.
Ownership History
Date
Name
Owned For
Owner Type
Purchase Details
Closed on
Nov 19, 2024
Sold by
Kash Douglas S
Bought by
Keopraseuth Sangvan
Current Estimated Value
Purchase Details
Closed on
Nov 22, 2023
Sold by
Hicks Eddie and Hicks Dena J
Bought by
Kash Douglas S
Purchase Details
Closed on
Oct 3, 2023
Sold by
Hicks Eddie and Hicks Dena J
Bought by
Hicks Eddie and Hicks Dena J
Purchase Details
Closed on
Sep 27, 2023
Sold by
Hicks Eddie and Hicks Dena J
Bought by
Hicks Eddie and Hicks Dena J
Purchase Details
Closed on
Aug 15, 2022
Sold by
Burbank Trevor M
Bought by
Hicks Eddie and Hicks Dena J
Purchase Details
Closed on
Nov 30, 2011
Sold by
Davis Martha
Bought by
Burbank Trevor M
Home Financials for this Owner
Home Financials are based on the most recent Mortgage that was taken out on this home.
Original Mortgage
$129,628
Interest Rate
3.87%
Mortgage Type
FHA
Create a Home Valuation Report for This Property
The Home Valuation Report is an in-depth analysis detailing your home's value as well as a comparison with similar homes in the area
Home Values in the Area
Average Home Value in this Area
Purchase History
| Date | Buyer | Sale Price | Title Company |
|---|---|---|---|
| Keopraseuth Sangvan | $145,000 | None Listed On Document | |
| Keopraseuth Sangvan | $145,000 | None Listed On Document | |
| Kash Douglas S | $75,000 | Landmark Title | |
| Hicks Eddie | -- | None Listed On Document | |
| Hicks Eddie | -- | None Listed On Document | |
| Hicks Eddie | -- | None Listed On Document | |
| Hicks Eddie | $200,000 | None Listed On Document | |
| Burbank Trevor M | $133,000 | Attorney |
Source: Public Records
Mortgage History
| Date | Status | Borrower | Loan Amount |
|---|---|---|---|
| Previous Owner | Burbank Trevor M | $129,628 |
Source: Public Records
Tax History Compared to Growth
Tax History
| Year | Tax Paid | Tax Assessment Tax Assessment Total Assessment is a certain percentage of the fair market value that is determined by local assessors to be the total taxable value of land and additions on the property. | Land | Improvement |
|---|---|---|---|---|
| 2024 | $6,469 | $8,230 | $8,230 | -- |
| 2023 | $6,469 | $99,750 | $47,330 | $52,420 |
| 2022 | $5,222 | $67,860 | $32,200 | $35,660 |
| 2021 | $4,635 | $67,860 | $32,200 | $35,660 |
| 2020 | $4,624 | $67,860 | $32,200 | $35,660 |
| 2019 | $3,922 | $52,770 | $32,200 | $20,570 |
| 2018 | $3,935 | $52,770 | $32,200 | $20,570 |
| 2017 | $3,911 | $52,770 | $32,200 | $20,570 |
| 2016 | $4,059 | $52,770 | $32,200 | $20,570 |
| 2015 | $3,981 | $52,770 | $32,200 | $20,570 |
| 2014 | $3,981 | $52,770 | $32,200 | $20,570 |
| 2012 | -- | $61,400 | $32,200 | $29,200 |
Source: Public Records
Map
Nearby Homes
- 3902 Augusta Rd
- 9228 Sawgrass Dr
- 9220 Sawgrass Dr
- 1 Pendle Point
- 1157 Bonniebrook Dr
- 2279 Rosina Dr
- 2127 Carrington Ln
- 2141 Rosina Dr
- 9539 Byers Rd
- 2475 Byers Ridge Dr
- 736 Decker Dr
- 1834 Mellow Dr
- 712 Decker Dr
- 2434 Whisper Dr
- 628 Jamestown Dr
- 2054 Prestwick Bend
- 1984 Cruden Bay Way
- 1131 Castleton Ct
- 1350 Vista Ridge Dr
- 00 Benner Rd
- 2290 Bluegrass Ct
- 2295 Bluegrass Ct
- 2280 Bluegrass Ct
- 1450 Alexandersville Rd
- 2285 Bluegrass Ct
- 1333 Alexandersville Rd
- 2270 Bluegrass Ct
- 3939 Benner Rd
- 2275 Bluegrass Ct
- 1320 Alexandersville Rd
- 2298 Appleblossom Dr
- 2304 Appleblossom Dr
- 2292 Appleblossom Dr
- 2260 Bluegrass Ct
- 1325 Swallow Ct
- 2324 Appleblossom Dr
- 2286 Appleblossom Dr
- 2250 Bluegrass Ct
- 1315 Swallow Ct
- 1335 Swallow Ct