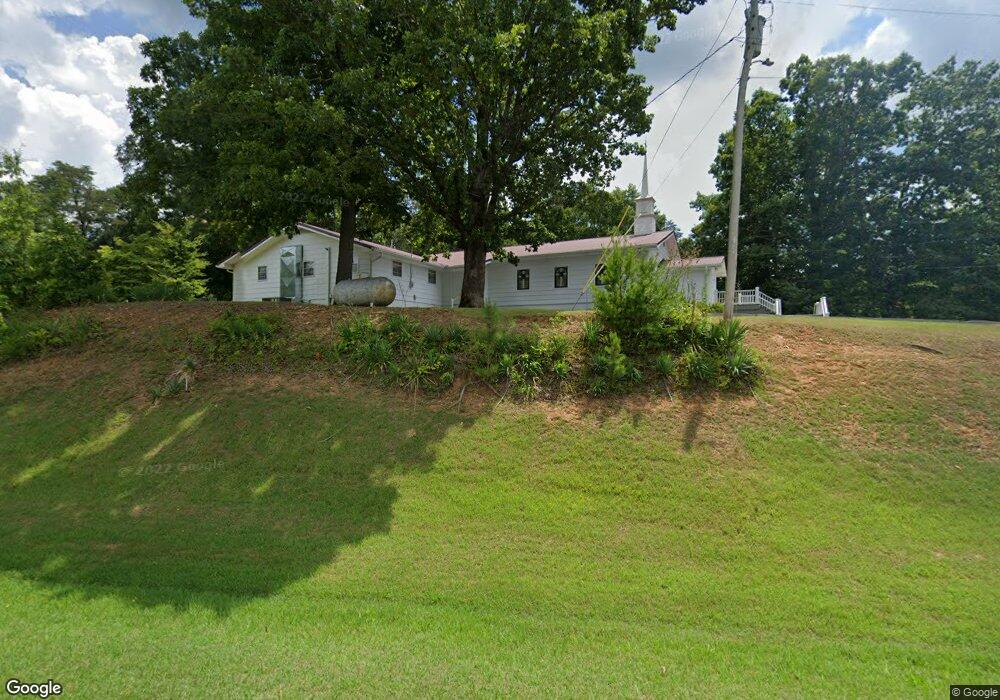
3991 Chamberlain Rd La Fayette, GA 30728
Center Post NeighborhoodEstimated Value: $120,822 - $217,000
--
Bed
1
Bath
864
Sq Ft
$209/Sq Ft
Est. Value
About This Home
This home is located at 3991 Chamberlain Rd, La Fayette, GA 30728 and is currently estimated at $180,706, approximately $209 per square foot. 3991 Chamberlain Rd is a home located in Walker County with nearby schools including Gilbert Elementary School, Lafayette Middle School, and Lafayette High School.
Ownership History
Date
Name
Owned For
Owner Type
Purchase Details
Closed on
May 30, 2025
Sold by
Hall Julie Dale
Bought by
Pegg Brandon Christopher
Current Estimated Value
Purchase Details
Closed on
May 12, 2022
Sold by
Avans Roger Eugene
Bought by
Hall Julie Dale
Purchase Details
Closed on
Apr 5, 2021
Sold by
Avans Roger Eugene
Bought by
Avans Roger Eugene
Purchase Details
Closed on
Mar 5, 2015
Sold by
Avans Roger E
Bought by
Avans Randy J and Avans Donna C
Purchase Details
Closed on
Feb 16, 2007
Sold by
Hensley Willard
Bought by
Eagle Donna J
Purchase Details
Closed on
Mar 3, 2006
Sold by
Avans Roger E
Bought by
Fairview South Bapist Church
Purchase Details
Closed on
May 30, 2002
Sold by
Avans John
Bought by
Avans Roger E
Purchase Details
Closed on
Sep 20, 1999
Sold by
Avans Robin
Bought by
Avans Roger
Purchase Details
Closed on
Jan 1, 1972
Bought by
Avans John
Create a Home Valuation Report for This Property
The Home Valuation Report is an in-depth analysis detailing your home's value as well as a comparison with similar homes in the area
Home Values in the Area
Average Home Value in this Area
Purchase History
| Date | Buyer | Sale Price | Title Company |
|---|---|---|---|
| Pegg Brandon Christopher | -- | -- | |
| Hall Julie Dale | $20,000 | -- | |
| Avans Roger Eugene | -- | -- | |
| Avans Randy J | -- | -- | |
| Eagle Donna J | $75,000 | -- | |
| Fairview South Bapist Church | $90,000 | -- | |
| Avans Roger E | -- | -- | |
| Avans Roger | $20,000 | -- | |
| Avans John | -- | -- |
Source: Public Records
Tax History Compared to Growth
Tax History
| Year | Tax Paid | Tax Assessment Tax Assessment Total Assessment is a certain percentage of the fair market value that is determined by local assessors to be the total taxable value of land and additions on the property. | Land | Improvement |
|---|---|---|---|---|
| 2024 | $960 | $41,106 | $14,918 | $26,188 |
| 2023 | $883 | $36,575 | $11,840 | $24,735 |
| 2022 | $640 | $23,679 | $7,164 | $16,515 |
| 2021 | $530 | $17,095 | $7,164 | $9,931 |
| 2020 | $502 | $15,449 | $7,164 | $8,285 |
| 2019 | $511 | $15,449 | $7,164 | $8,285 |
| 2018 | $409 | $15,449 | $7,164 | $8,285 |
| 2017 | $0 | $15,449 | $7,164 | $8,285 |
| 2016 | $613 | $19,731 | $7,306 | $12,425 |
| 2015 | $982 | $32,700 | $12,120 | $20,580 |
| 2014 | $915 | $33,692 | $13,112 | $20,580 |
| 2013 | $409 | $33,692 | $13,112 | $20,580 |
Source: Public Records
Map
Nearby Homes
- 0 Ga Hwy 337 Unit LotWP001
- 6670 Highway 337
- 3523 E Broomtown Rd
- 0 Indiana St Unit 28 10583802
- 0 Martindale Rd Unit 10608820
- 0 Martindale Rd Unit 1520834
- 334 S Oakland Dr
- 300 Bronco Rd
- 308 Pledger Pkwy
- 39 Cook St
- 0 Shattuck Industrial Blvd Unit 1522887
- 0 Shattuck Industrial Blvd Unit 10630977
- 62 + - Acres On Chamberlain Rd
- 0 Chamberlain Rd Unit LotWP001
- 100 Lake Terrace Dr
- Perry Plan at Lake Terrace
- Sullivan Plan at Lake Terrace
- Lewis Plan at Lake Terrace
- Curtis Plan at Lake Terrace
- Edmon Plan at Lake Terrace
- 0 Rape Dr Unit 7224215
- 0 Rape Dr Unit 7224202
- 46 Rape Dr
- 3990 Chamberlain Rd
- 3909 Chamberlain Rd
- 4094 Chamberlain Rd
- 3916 Chamberlain Rd
- 101 Rape Dr
- 4119 Chamberlain Rd
- 4119 Chamberlain Rd
- 3717 Chamberlain Rd
- 341 Rape Dr
- 200 Dixon Springs Rd
- 3666 Chamberlain Rd
- 3628 Chamberlain Rd
- 3628 Chamberlain Rd
- 121 Gilbreath Ln
- 148 Dixon Springs Rd
- 58 Rocky Ct
- 202 Dixon Springs Rd