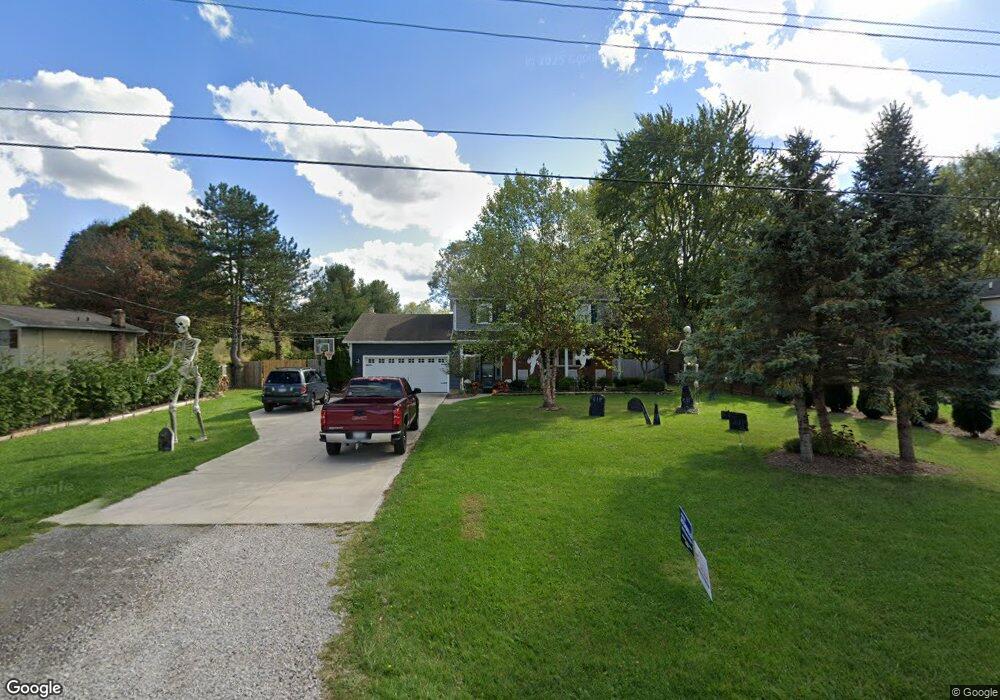
39915 State Route 303 Lagrange, OH 44050
Estimated Value: $321,000 - $388,000
4
Beds
3
Baths
2,072
Sq Ft
$174/Sq Ft
Est. Value
About This Home
This home is located at 39915 State Route 303, Lagrange, OH 44050 and is currently estimated at $360,753, approximately $174 per square foot. 39915 State Route 303 is a home located in Lorain County with nearby schools including Keystone Elementary School, Keystone Middle School, and Keystone High School.
Ownership History
Date
Name
Owned For
Owner Type
Purchase Details
Closed on
Jun 11, 2012
Sold by
Durante Brian C and Durante Theresa C
Bought by
Durante Brian C and Durante Theresa C
Current Estimated Value
Home Financials for this Owner
Home Financials are based on the most recent Mortgage that was taken out on this home.
Original Mortgage
$169,000
Interest Rate
3.87%
Mortgage Type
Future Advance Clause Open End Mortgage
Purchase Details
Closed on
Nov 14, 2006
Sold by
Fiest John W and Fiest Judith K
Bought by
Durante Brian C and Narowitz Theresa C
Home Financials for this Owner
Home Financials are based on the most recent Mortgage that was taken out on this home.
Original Mortgage
$176,000
Interest Rate
6.36%
Mortgage Type
Purchase Money Mortgage
Create a Home Valuation Report for This Property
The Home Valuation Report is an in-depth analysis detailing your home's value as well as a comparison with similar homes in the area
Home Values in the Area
Average Home Value in this Area
Purchase History
| Date | Buyer | Sale Price | Title Company |
|---|---|---|---|
| Durante Brian C | -- | None Available | |
| Durante Brian C | $176,000 | First American |
Source: Public Records
Mortgage History
| Date | Status | Borrower | Loan Amount |
|---|---|---|---|
| Closed | Durante Brian C | $169,000 | |
| Closed | Durante Brian C | $176,000 |
Source: Public Records
Tax History Compared to Growth
Tax History
| Year | Tax Paid | Tax Assessment Tax Assessment Total Assessment is a certain percentage of the fair market value that is determined by local assessors to be the total taxable value of land and additions on the property. | Land | Improvement |
|---|---|---|---|---|
| 2024 | $4,211 | $102,368 | $30,884 | $71,484 |
| 2023 | $4,233 | $86,156 | $26,996 | $59,161 |
| 2022 | $4,202 | $86,156 | $26,996 | $59,161 |
| 2021 | $4,202 | $86,156 | $26,996 | $59,161 |
| 2020 | $3,322 | $60,760 | $22,090 | $38,670 |
| 2019 | $3,301 | $60,760 | $22,090 | $38,670 |
| 2018 | $3,221 | $60,760 | $22,090 | $38,670 |
| 2017 | $3,183 | $56,280 | $21,020 | $35,260 |
| 2016 | $3,160 | $56,280 | $21,020 | $35,260 |
| 2015 | $3,155 | $56,280 | $21,020 | $35,260 |
| 2014 | $2,753 | $56,280 | $21,020 | $35,260 |
| 2013 | $2,667 | $56,280 | $21,020 | $35,260 |
Source: Public Records
Map
Nearby Homes
- 0 Dill Ct Unit 5072837
- 194 Railroad St
- 607 Rundle St
- 630 Rundle St
- 548 William St
- 516 Appomattox Ct
- 110 Railroad St
- 800 Buckingham Dr
- 808 Buckingham Dr
- 433 N Center St
- 822 Robinson Dr
- 831 Robinson Dr
- 829 Robinson Dr
- 40725 Biggs Rd
- 128 Harvest Ct
- 756 N Center St
- 171 Keywood Blvd
- 19045 Whitehead Rd
- 41635 Parsons Rd
- 40175 Banks Rd
- 39937 State Route 303
- 39851 State Route 303
- 39893 State Route 303
- 39983 State Route 303
- 39829 State Route 303
- 39807 State Route 303
- 39872 State Route 303
- 40015 State Route 303
- 40000 State Route 303
- 17757 Wheeler Rd
- 39775 State Route 303
- 39798 State Route 303
- 40033 State Route 303
- 17500 Wheeler Rd
- 40038 State Route 303
- 17613 Wheeler Rd
- 39737 State Route 303
- 39756 State Route 303
- 39715 State Route 303
- 40104 State Route 303