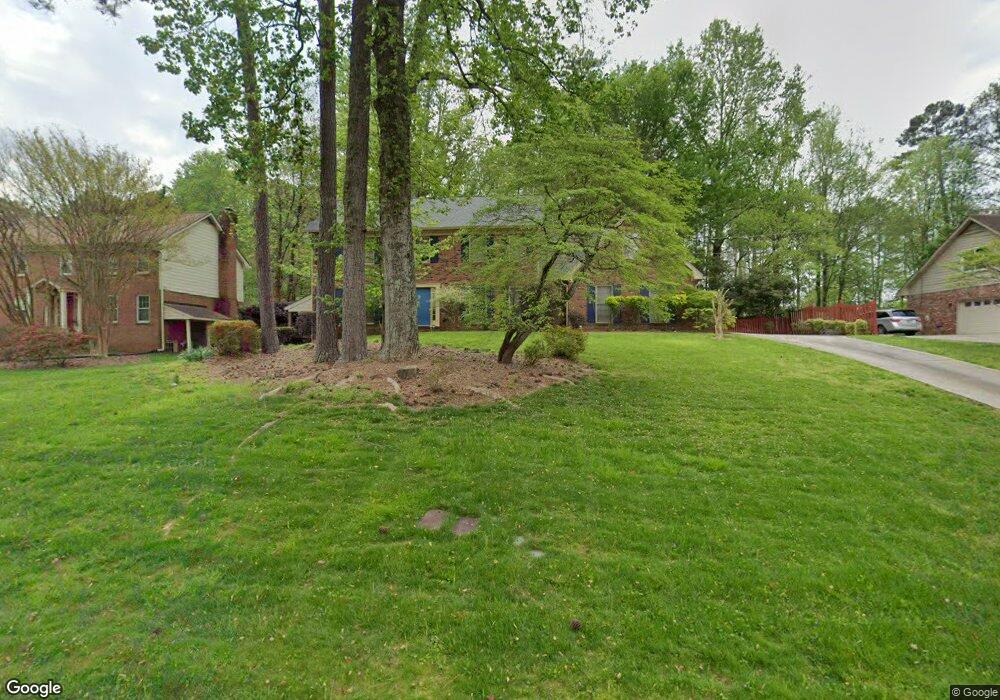
3992 Glen Meadow Dr Norcross, GA 30092
Estimated Value: $602,000 - $688,000
5
Beds
4
Baths
2,702
Sq Ft
$235/Sq Ft
Est. Value
About This Home
This home is located at 3992 Glen Meadow Dr, Norcross, GA 30092 and is currently estimated at $634,922, approximately $234 per square foot. 3992 Glen Meadow Dr is a home located in Gwinnett County with nearby schools including Simpson Elementary School, Pinckneyville Middle School, and Norcross High School.
Ownership History
Date
Name
Owned For
Owner Type
Purchase Details
Closed on
Dec 10, 2010
Sold by
Ohio Farmers Insurance Co
Bought by
Freedman Aaron and Freedman Shoshana M
Current Estimated Value
Home Financials for this Owner
Home Financials are based on the most recent Mortgage that was taken out on this home.
Original Mortgage
$240,738
Outstanding Balance
$158,051
Interest Rate
4.25%
Mortgage Type
FHA
Estimated Equity
$476,871
Purchase Details
Closed on
Mar 10, 2010
Sold by
Collins Thomas A
Bought by
Ohio Farmers Insurance Co
Purchase Details
Closed on
Dec 1, 1997
Sold by
Eriksson Goran Arne
Bought by
Wilburn David and Wilburn Eileen
Home Financials for this Owner
Home Financials are based on the most recent Mortgage that was taken out on this home.
Original Mortgage
$148,250
Interest Rate
7.38%
Mortgage Type
New Conventional
Create a Home Valuation Report for This Property
The Home Valuation Report is an in-depth analysis detailing your home's value as well as a comparison with similar homes in the area
Home Values in the Area
Average Home Value in this Area
Purchase History
| Date | Buyer | Sale Price | Title Company |
|---|---|---|---|
| Freedman Aaron | $247,000 | -- | |
| Ohio Farmers Insurance Co | -- | -- | |
| Wilburn David | $192,500 | -- |
Source: Public Records
Mortgage History
| Date | Status | Borrower | Loan Amount |
|---|---|---|---|
| Open | Freedman Aaron | $240,738 | |
| Previous Owner | Wilburn David | $148,250 |
Source: Public Records
Tax History Compared to Growth
Tax History
| Year | Tax Paid | Tax Assessment Tax Assessment Total Assessment is a certain percentage of the fair market value that is determined by local assessors to be the total taxable value of land and additions on the property. | Land | Improvement |
|---|---|---|---|---|
| 2025 | $8,286 | $229,560 | $50,160 | $179,400 |
| 2024 | $7,993 | $219,200 | $50,400 | $168,800 |
| 2023 | $7,993 | $192,280 | $44,000 | $148,280 |
| 2022 | $6,422 | $174,040 | $36,000 | $138,040 |
| 2021 | $5,433 | $143,080 | $35,520 | $107,560 |
| 2020 | $5,463 | $143,080 | $35,520 | $107,560 |
| 2019 | $5,022 | $136,240 | $30,000 | $106,240 |
| 2018 | $5,037 | $136,240 | $30,000 | $106,240 |
| 2016 | $4,314 | $116,720 | $24,000 | $92,720 |
| 2015 | $4,364 | $116,720 | $24,000 | $92,720 |
| 2014 | $4,252 | $116,720 | $24,000 | $92,720 |
Source: Public Records
Map
Nearby Homes
- 3922 Glen Meadow Dr
- 3910 Spalding Bluff Dr
- 6169 Poplar Bluff Cir
- 4053 Spalding Hollow NW
- 3710 Wedgewood Chase Unit 22
- 3962 Gunnin Rd
- 5970 Rachel Ridge Unit 2
- 6296 Courtside Dr
- 5885 Match Point
- 5961 Ranger Ct
- 507 Peachtree Forest Terrace
- 6040 Neely Farm Dr Unit 3
- 601 Peachtree Forest Ave
- 4291 River Bottom Dr
- 6425 Deerings Ln Unit 6425
- 3810 Courtside Terrace
- 6433 Deerings Ln
- 3982 Glen Meadow Dr
- 4002 Glen Meadow Dr
- 4002 Glen Meadow Dr NW
- 3972 Glen Meadow Dr
- 4012 Glen Meadow Dr
- 3983 Glen Meadow Dr
- 3993 Glen Meadow Dr
- 6597 Rosecommon Dr
- 3973 Glen Meadow Dr
- 4003 Glen Meadow Dr Unit III
- 6607 Rosecommon Dr
- 3962 Glen Meadow Dr
- 4022 Glen Meadow Dr
- 4013 Glen Meadow Dr
- 3963 Glen Meadow Dr
- 6587 Rosecommon Dr
- 6157 Rosecommon Dr
- 4023 Glen Meadow Dr Unit 7
- 4023 Glen Meadow Dr
- 4012 Primrose Ln