Estimated Value: $501,437 - $583,000
4
Beds
3
Baths
2,259
Sq Ft
$244/Sq Ft
Est. Value
About This Home
This home is located at 3993 Shadowind Way, Gotha, FL 34734 and is currently estimated at $551,359, approximately $244 per square foot. 3993 Shadowind Way is a home located in Orange County with nearby schools including Thornebrooke Elementary School, Gotha Middle School, and Olympia High.
Ownership History
Date
Name
Owned For
Owner Type
Purchase Details
Closed on
Apr 12, 2017
Sold by
Williams Gertrude Kearney and Bowman Jerrell W
Bought by
Williams Gertrude Kearney and Kearney Sheena Maria
Current Estimated Value
Purchase Details
Closed on
Sep 10, 2006
Sold by
Kearney Sheena M
Bought by
Williams Gertrude Kearney
Home Financials for this Owner
Home Financials are based on the most recent Mortgage that was taken out on this home.
Original Mortgage
$93,750
Interest Rate
7%
Mortgage Type
Stand Alone Second
Purchase Details
Closed on
Aug 4, 2006
Sold by
Bowman Jerrell W and Williams Gertrude E
Bought by
Kearney Sheena M
Home Financials for this Owner
Home Financials are based on the most recent Mortgage that was taken out on this home.
Original Mortgage
$93,750
Interest Rate
7%
Mortgage Type
Stand Alone Second
Create a Home Valuation Report for This Property
The Home Valuation Report is an in-depth analysis detailing your home's value as well as a comparison with similar homes in the area
Home Values in the Area
Average Home Value in this Area
Purchase History
| Date | Buyer | Sale Price | Title Company |
|---|---|---|---|
| Williams Gertrude Kearney | -- | None Available | |
| Williams Gertrude Kearney | -- | None Available | |
| Kearney Sheena M | $375,000 | Multiple |
Source: Public Records
Mortgage History
| Date | Status | Borrower | Loan Amount |
|---|---|---|---|
| Previous Owner | Kearney Sheena M | $93,750 | |
| Previous Owner | Kearney Sheena M | $281,250 |
Source: Public Records
Tax History
| Year | Tax Paid | Tax Assessment Tax Assessment Total Assessment is a certain percentage of the fair market value that is determined by local assessors to be the total taxable value of land and additions on the property. | Land | Improvement |
|---|---|---|---|---|
| 2025 | $3,208 | $231,467 | -- | -- |
| 2024 | $2,728 | $224,944 | -- | -- |
| 2023 | $2,728 | $197,328 | $0 | $0 |
| 2022 | $2,618 | $191,581 | $0 | $0 |
| 2021 | $2,569 | $186,001 | $0 | $0 |
| 2020 | $2,442 | $183,433 | $0 | $0 |
| 2019 | $2,504 | $179,309 | $0 | $0 |
| 2018 | $2,480 | $175,966 | $0 | $0 |
| 2017 | $2,438 | $255,751 | $50,000 | $205,751 |
| 2016 | $2,410 | $222,273 | $40,000 | $182,273 |
| 2015 | $2,450 | $207,395 | $40,000 | $167,395 |
| 2014 | $2,499 | $189,050 | $36,000 | $153,050 |
Source: Public Records
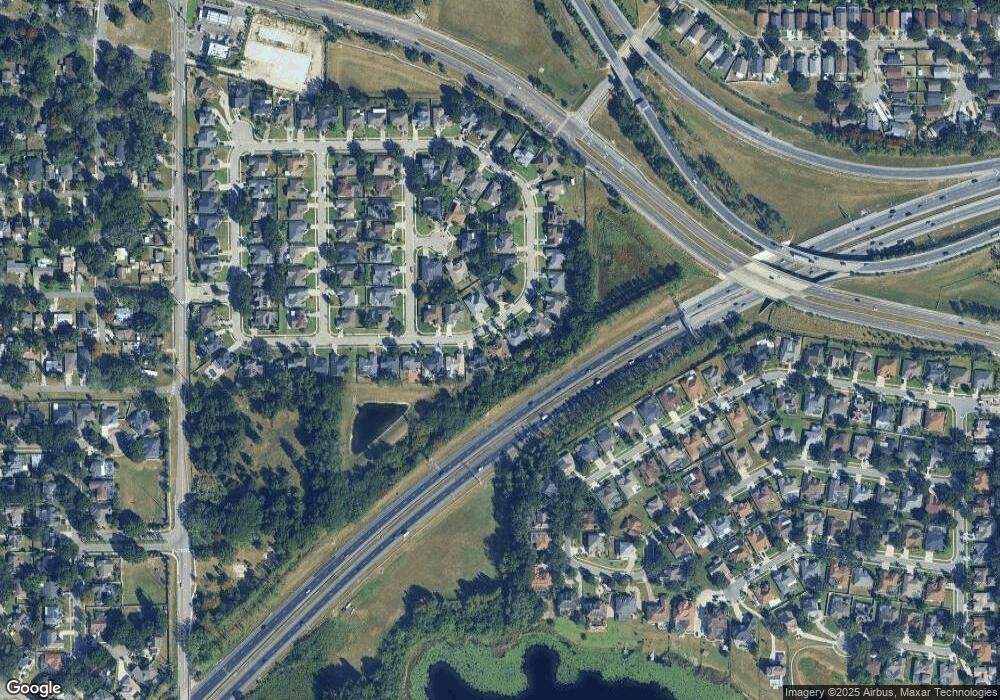
Map
Nearby Homes
- 1658 Hempel Ave
- 9101 Lake Coventry Ct
- 9126 Lake Coventry Ct
- 3625 Pompano Ct
- 3607 Breeders Cup Ct
- 9467 Lake Lotta Cir
- 1707 Twin Lake Dr
- 1882 Lake Pearl Dr
- 3321 Furlong Way
- 970 Davenwood Ct
- 935 Davenwood Ct
- 946 Davenwood Ct
- 537 Woodlawn Cemetery Rd
- 1101 Vintage Village Ln Unit 101
- 1101 Vintage Village Ln Unit 103
- 608 Bridge Creek Blvd
- 1990 Erving Cir Unit 108
- 1990 Erving Cir Unit 101
- 2000 Erving Cir Unit 102
- 2015 Erving Cir Unit 307
- 3999 Shadowind Way
- 3987 Shadowind Way
- 4005 Shadowind Way
- 3981 Shadowind Way
- 3992 Shadowind Way
- 4006 Shadowind Way
- 3980 Shadowind Way
- 4011 Shadowind Way
- 3975 Shadowind Way
- 4012 Shadowind Way
- 3906 Ballinore Place
- 3962 Shadowind Way
- 4017 Shadowind Way
- 3969 Shadowind Way
- 3900 Ballinore Place
- 3963 Shadowind Way
- 4023 Shadowind Way
- 3912 Ballinore Place
- 1644 Cerulean Way
- 1638 Cerulean Way
Your Personal Tour Guide
Ask me questions while you tour the home.